 Loading
Loading
Loading
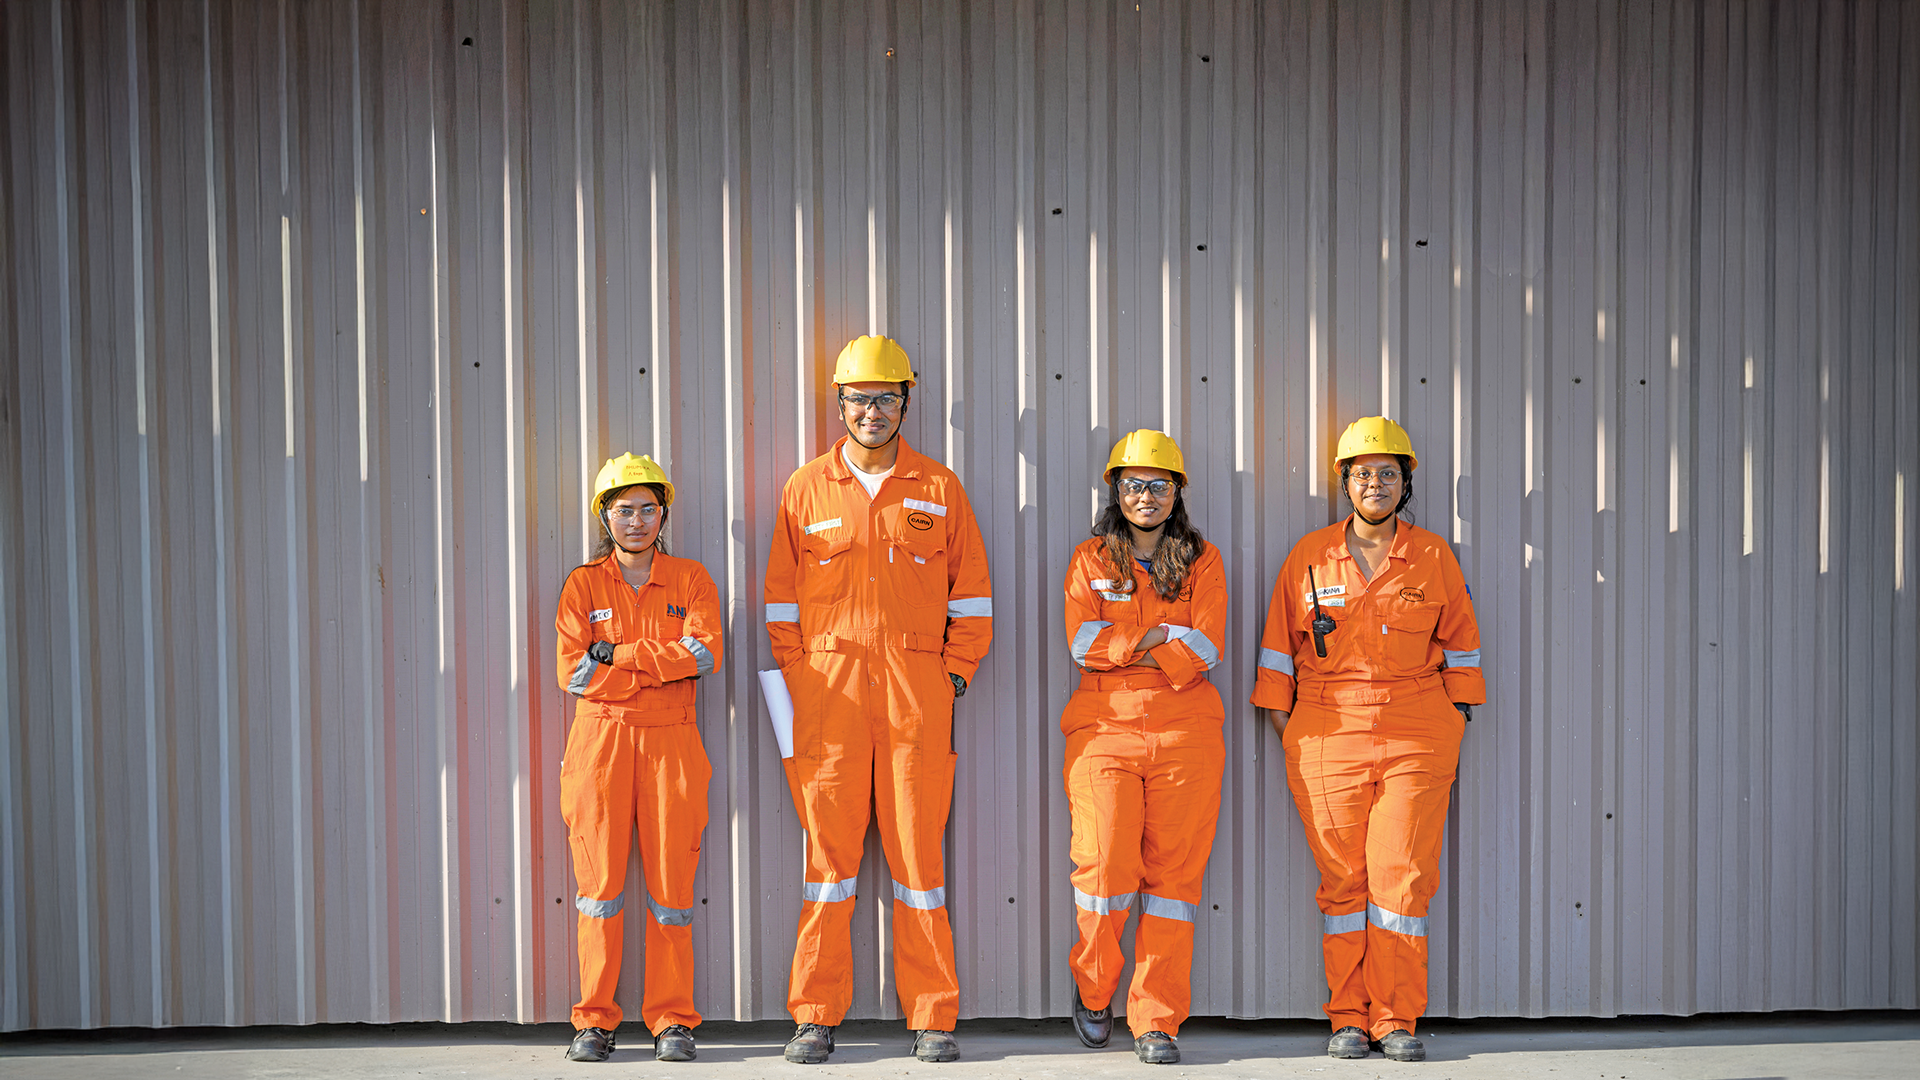
Zinc India
Zinc International
Oil and Gas
Total employment generation
tCO2e in avoided emissions from FY 2020-21 baseline
exchequer contribution
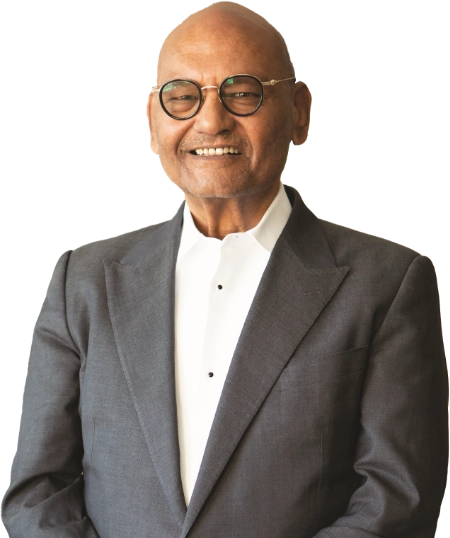
I have spent most of my life believing that India's greatest wealth lies below the ground. And that it holds the key to prosperity for Bharat. This year, Vedanta delivered its best-ever financial performance. But more importantly, it continued to create tremendous value for the nation, for our communities, for our shareholders, business partners and our workforce.
We are at the dawn of a new era in the Vedanta journey. And I am pleased to share that we have done that on the back of an excellent performance. This year, we continued to break new ground, not just in financial metrics but in the way we work and the way we do business.

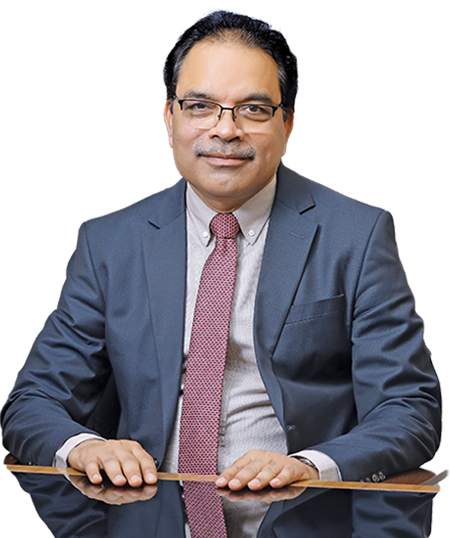
FY 2025-26 was a year of decisive execution and transformational progress for Vedanta. We successfully commissioned several strategic growth projects across our portfolio, strengthening our capacity, enhancing competitiveness, and creating a robust foundation for the next phase of growth.
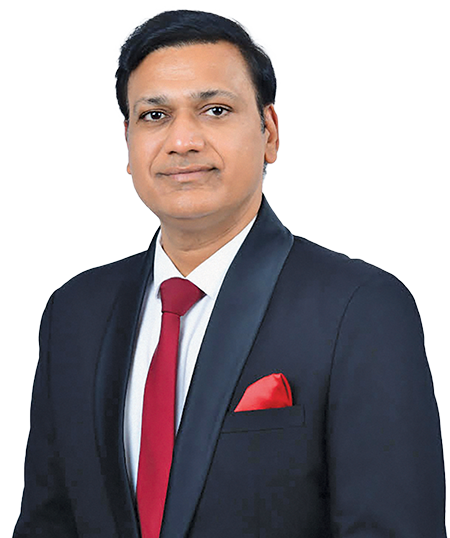
FY 2025-26 was a landmark year for Vedanta, reflecting the strength of our operating model, disciplined financial management, and unwavering focus on value creation.


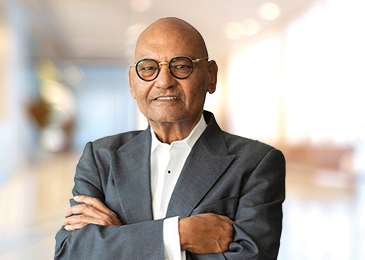
Non Executive Chairman

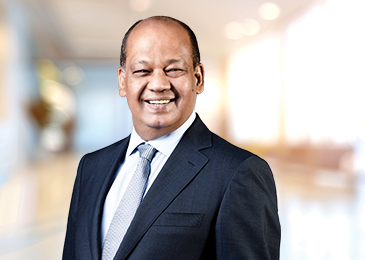
Executive Vice Chairman

Non-Executive Non-Independent Director
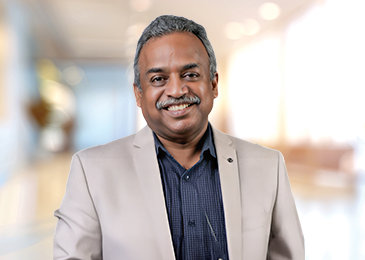
Non-Executive Independent Director
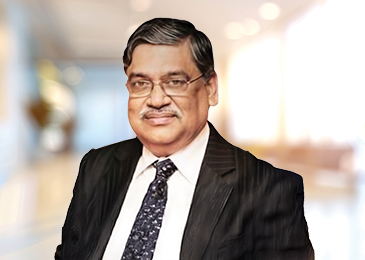
Non-Executive Independent Director
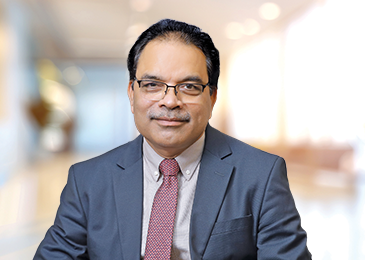
Executive Director
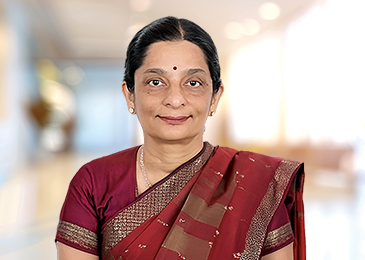
Non-Executive Independent Director
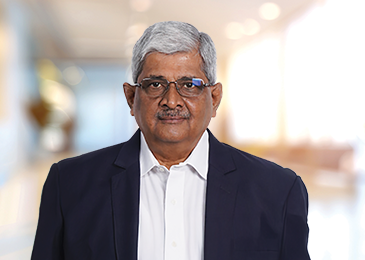
Non-Executive Independent Director

We are focussed on disciplined capital allocation to support sustainable growth, maintain a strong balance sheet, and generate robust free cash flows.
Revenue

EBITDA


Continuous investment in high-quality assets strengthens operational reliability and responsiveness to evolving market demand.
Historic high mined metal production
Second-best refined metal production
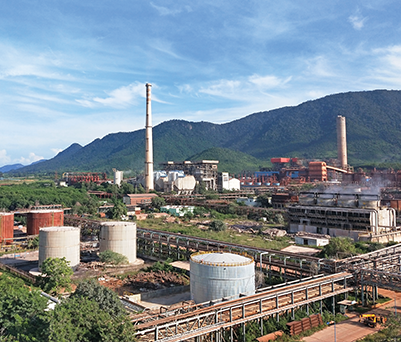

Knowledge, technology and innovation drive operational excellence and competitiveness. Ongoing investments in digital transformation, analytics and technology adoption strengthen efficiency, resilience and future readiness.
R&D Spend
Patents received in FY 2025-26


Strong stakeholder relationships built on trust and shared value reinforce our licence to operate. Continuous engagement with communities, partners and institutions supports responsible operations, strengthens reputation and enables effective strategy execution.
Nand Ghars built
Total CSR beneficiaries


Our skilled workforce powers operational success and longterm growth. We invest in capability building, leadership development, health, safety and well-being, guided by a zero-harm philosophy.
Total Workforce
Women employees

Our world-class resource base across India and Africa provides long-term operational visibility. Responsible resource management and environmental stewardship remain central to minimising ecological impact while generating sustainable social and economic value.
Combined R&R
Gross proved, and probable reserves and resources
World’s largest zinc-lead mine at Rampura Agucha, India
Largest aluminium production capability in India at 2.44 MTPA
Total acreage of >47,000 sq km across India
TSPL: 1,980 MW supercritical plant
Karnataka iron ore mine with reserves of 60 million tonnes
Largely operates in long steel products
Ostapal and Kalarangiatta Mines with 1.15 MTPA mining capacity
Tuticorin smelter and refinery are currently not operational


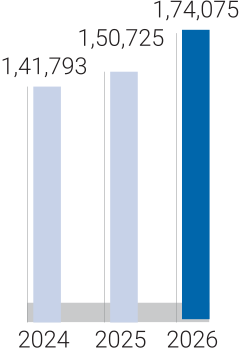
Description: Revenue represents the value of goods sold and services provided to third parties during the year
Commentary:In FY 2025-26, consolidated revenue was at ₹ 1,74,075 crore compared with ₹ 1,50,725 crore in FY 2024-25. This was driven by higher volumes, favourable commodity prices and rupee depreciation
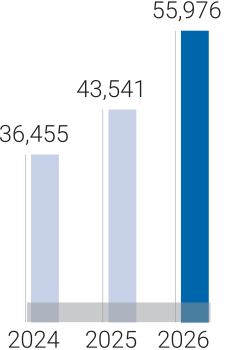
Description:Earnings before interest, tax, depreciation and amortisation (EBITDA) is a factor of volume, prices and cost of production. This measure is calculated by adjusting operating profit for special items and adding depreciation and amortisation.
Commentary:EBITDA for FY 2025-26 was at ₹ 55,976 crore, registering a Y-o-Y growth of 29% This was primarily driven by stronger commodity prices, rupee depreciation, favourable input cost, higher sales volumes and improved premium mix.
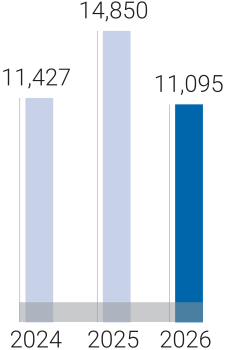
Description: This represents net cash flow from operations after investing in growth projects. This measure ensures that profit generated by our assets is reflected by cash flow, in order to de-lever or maintain future growth or shareholder returns.
Commentary:We generated FCF of ₹ 11,095 crore in FY 2025-26, driven by strong cash flow from operations, working capital investment and expenditure on growth projects.
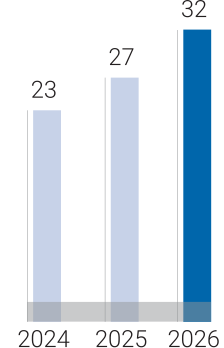
Description:This is calculated on the basis of operating profit, before special items and net of tax outflow, as a ratio of average capital employed. The objective is to earn a post-tax return consistently above the weighted average cost of capital.
Commentary:Strong ROCE of c.32% in FY 2025-26 (FY 2024-25: 27%), primarily due to increase in EBIT.
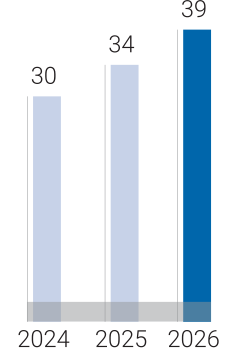
Description: Calculated as EBITDA margin excluding EBITDA and turnover from custom smelting of copper business and one off gains.
Commentary: Adjusted EBITDA margin for FY 2025-26 was 39% (FY 2024-25: 34%).
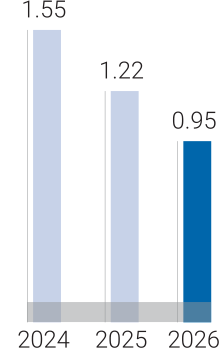
Description:This ratio represents the level of leverage of the Company. It represents the strength of the balance sheet of Vedanta Limited. Net debt is calculated in the manner as defined in Note 15 of the consolidated financial statements.
Commentary:Net debt/EBITDA ratio as of 31 March 2026 was at 0.95x, compared with 1.22x as on 31 March 2025.
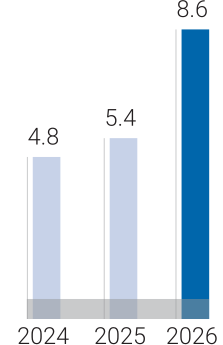
Description: The ratio is a representation of the ability of the Company to service its debt. It is computed as a ratio of EBITDA divided by gross finance costs (including capitalised interest) less investment revenue.
Commentary:The interest cover for the Company was at c.8.6 times, higher Y-o-Y on account of increased EBITDA and lower interest.
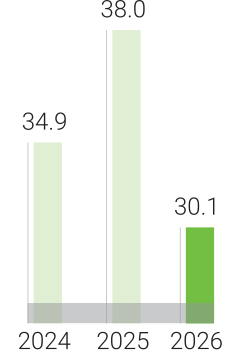
Description:The debtors’ turnover ratio is an accounting measure used to quantify a Company's effectiveness in collecting its receivables. This is calculated as a ratio of revenue from operation to average trade receivables.
Commentary:The debtor’s turnover ratio was at 30.1 times.
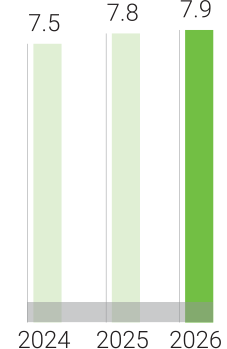
Description:The inventory turnover ratio is an efficiency ratio that shows how effectively inventory is managed. This is calculated as a ratio of cost of goods sold to average inventory.
Commentary:The inventory turnover ratio for the Company was at 7.9 times in FY 2025-26 as compared to 7.8 times in FY 2024-25.
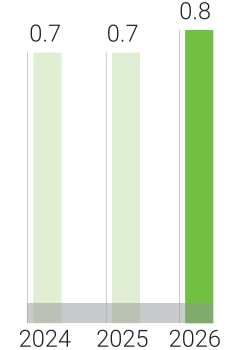
Description:The current ratio is a liquidity ratio that measures a Company's ability to pay short-term obligations or those due within one year. This is calculated as a ratio of Current Assets to Current Liabilities.
Commentary:The current ratio of the Company is 0.8 times
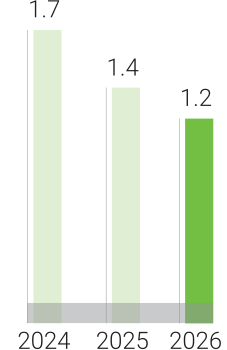
Description: It is a financial ratio indicating the relative proportion of shareholders' equity and debt used to finance a Company's assets. This is calculated as a ratio of total external borrowing to total equity (share capital + reserves + minority).
Commentary:The ratio has decreased to 1.2 times in FY 2025-26 as compared to 1.4 times in FY 2024-25 primarily due to increase in total equity
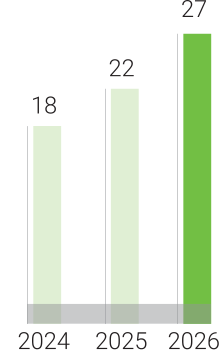
Description: Operating profit margin is a profitability or performance ratio used to calculate the percentage of profit a Company produces from its operations. This is calculated as a ratio of operating profit (EBITDA less depreciation) to revenue from operations.
Commentary:The operating profit margin is higher in FY 2025-26 as compared to FY 2024-25, primarily due to higher EBITDA in the current year.
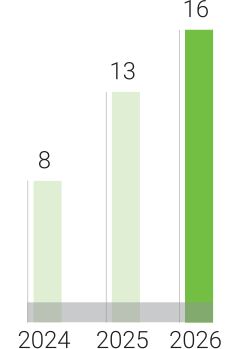
Description: It is a measure of the profitability of the Company. This is calculated as a ratio of net profit (before exceptional items) to revenue from operations.
Commentary:The net profit margin is 16% in FY 2025-26 as compared to 13% in FY 2024-25.
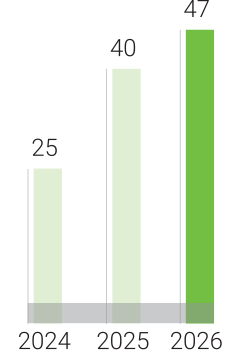
Description:It is a measure of the profitability of the Company. This is calculated as a ratio of net profit (before exceptional items) to average net worth (share capital + reserves + minority).
Commentary:The return on net worth is 47% in FY 2025-26 as compared to 40% in FY 2024-25, higher 7% Y-o-Y.
*Excluding litigated debtors in power business
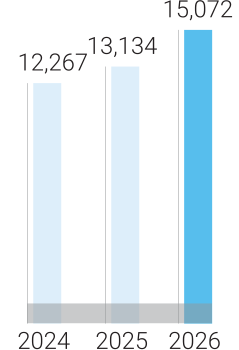
Description:This represents the amount invested in our organic growth programme during the year.
Commentary: Our stated strategy is of disciplined capital allocation on high-return, low-risk projects. Capital expenditure on expansion during the year stood at ₹ 15,072 crore.
Description:Reserves and resources are based on specified guidelines for each commodity and region.
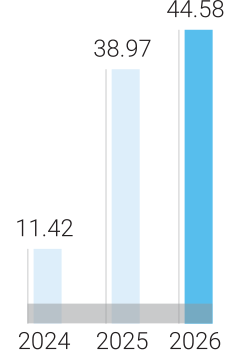
Description:This represents the net profit attributable to equity shareholders.
Commentary: In FY 2025-26, EPS before exceptional items was at ₹ 44.58 per share, as compared to ₹ 38.97 in FY 2024-25.
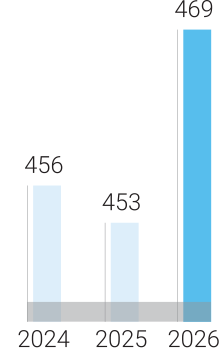
Commentary:
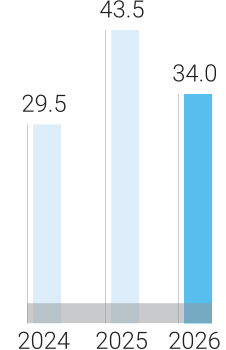
Description:Dividend per share is the total of the final dividend recommended by the Board in relation to the year, and the interim dividend paid out during the year.
Commentary:The Board has recommended a total interim dividend of ₹ 34 per share in FY 2025-26 as compared with ₹ 43.50 per share in FY 2024-25.
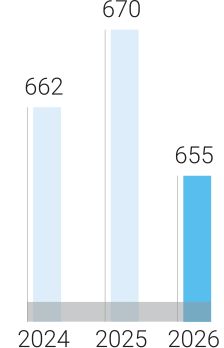
Commentary:
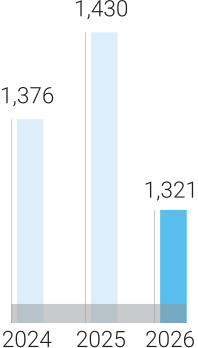
Commentary:During FY 2025-26, the gross proved, and probable reserves and resources stood at 1,321 mmboe.
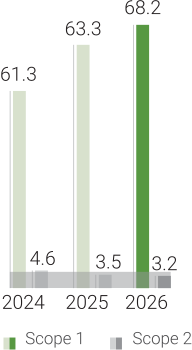
Description:Vedanta used Scope 1 and Scope 2 GHG emissions, measured in tonnes of CO2e to track its carbon footprint. We calculate and report Greenhouse Gas (GHG) inventory i.e. Scope 1 (process emissions and other direct emissions) and Scope 2 (purchased electricity) as defined under the World Business Council for Sustainable Development (WBCSD) and World Resource Institute (WRI) GHG Protocol.
Commentary: Overall GHG emission increased by ~7% Y-o-Y.
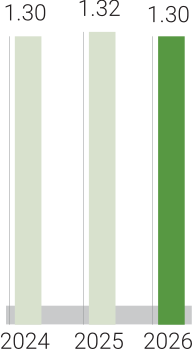
Description:The total recordable injury frequency rate (TRIFR) is the number of fatalities, lost time injuries, and other injuries requiring treatment by a medical professional per million hours worked.
Commentary:This year, the TRIFR was 1.30. Safety remains the key focus across businesses.
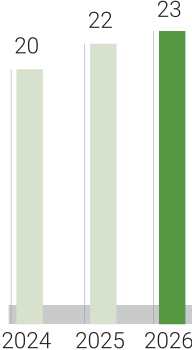
Description:The percentage of women in the total permanent employee workforce.
Commentary:We focus on diversity, equity and inclusion in the workplace. During the year, female employees made up 23% of the total workforce.
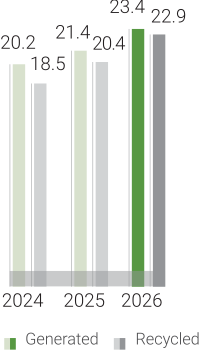
Description:High Volume Low Toxicity (HVLT) waste is present in large quantities and is usually stored in tailings dams/ash dyes or other secure landfill structures before being sent to other industries as raw materials. HVLT includes fly ash, bottom ash, slag, jarosite, and red mud.
Commentary:In FY 2025-26, we have achieved ~98% utilisation of our HVLT waste.
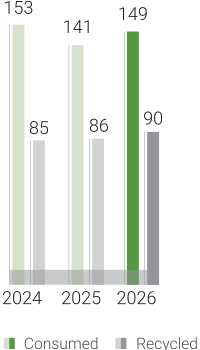
Description:Water consumed is the portion of water used that is not returned to the source after being withdrawn. Recycled water or reclaimed water means treated or recycled wastewater commonly used for non‑potable (not for drinking) purposes, such as agriculture, landscape, public parks, and golf course irrigation (million m3).
Commentary:In FY 2025-26, we recycled 90 million m3 of water, equivalent to around 38% of our water consumption.
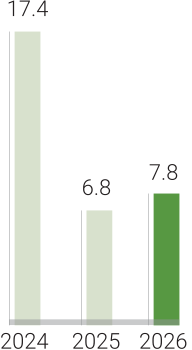
Description:The total number of beneficiaries through our community development programmes across all our operations.
Commentary:We benefited 7.8 million people this year through our community development projects comprising community health, nutrition, education, water and sanitation, sustainable livelihood, women empowerment and bio-investment.
* Water consumption = Water consumed + Water recycled

Resources and Relationships Deployed
Outcomes


Exploration

Asset development

Extraction

Processing

Value addition and marketing

Care

Integrity

Innovation

Agility

Ownership

Resources and Relationships Deployed
Outcomes

Exploration
Asset development
Extraction
Processing
Value addition and marketing
Care
Integrity
Innovation
Agility
Ownership

Resources and Relationships Deployed
Outcomes

Exploration
Asset development
Extraction
Processing
Value addition and marketing
Care
Integrity
Innovation
Agility
Ownership

Resources and Relationships Deployed
Outcomes

Exploration
Asset development
Extraction
Processing
Value addition and marketing
Care
Integrity
Innovation
Agility
Ownership

Resources and Relationships Deployed
Outcomes
Exploration
Asset development
Extraction
Processing
Value addition and marketing
Care
Integrity
Innovation
Agility
Ownership

Information coverage:Disclosures on triple bottom line performance
Standards/Guidelines used:Global Reporting Initiative (GRI) Standards
Information coverage: Voluntary disclosure of profits made and taxes paid (only Indian company to publish a TTR)
Standards/Guidelines used:Indian Accounting Standards (Ind AS)

Information coverage: Holistic disclosure of performance and strategy
Standards/Guidelines used: International Integrated Reporting Framework, Indian Accounting Standards (Ind AS) Indian Secretarial Standards
Information coverage: Climate-related financial disclosures
Standards/Guidelines used: Approach to climate action, climate strategy and climate risk management

Information coverage: Nature related financial Disclosure
Standards/Guidelines used:Approach towards biodiversity strategy and risk management




Social And Relationship Capital
Resources and Relationships Deployed
Outcomes Delivered In Fy 2025-26
Outcomes
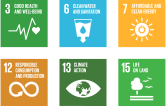
SDGs positively impacted
Our Value Chain Activities
Exploration
Asset development
Extraction
Processing
Value addition and marketing
Vedanta 2.0 Values
Care
Integrity
Innovation
Agility
Ownership