We are focussed on disciplined capital allocation to support sustainable growth, maintain a strong balance sheet, and generate robust free cash flows. All investment decisions are carefully evaluated in the context of the Group’s financial resources, with the objective of driving long-term growth and maximising returns for shareholders, as the Group undergoes a strategic demerger into five independent, sector specificand pure-play companies.

Revenue
15% Y-o-YEBITDA
29% Y-o-YNet Debt/EBITDA
EBITDA margin1
470 bps Y-o-YROCE
539 bps Y-o-YDividend Declared
PAT (before exceptional and one-time gain)
47% Y-o-YPAT (after exceptional and one-time gain)
22% Y-o-YCash and cash equivalents Strong Liquidity Position
Free cash flow (FCF) post-capex
CRISIL Rating
Growth capex
Net debt
Gross Debt
Footnote: 1. Excluding customs smelting at Copper Business and one-off gain

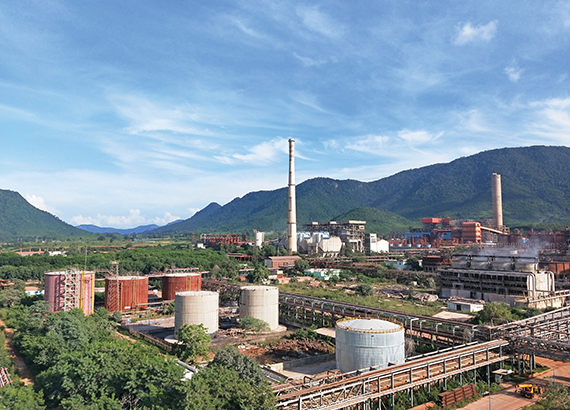
Continuous investment in high-quality assets strengthens operational reliability and responsiveness to evolving market demand. Advance technologies, vertical integration and expansion initiatives enhance efficiency, safety and long-term stability
Business Highlights
Historic high mined metal production
2% Y-o-YSecond-best refined metal production
Saleable silver production
9% Y-o-YAnnual mined metal production
27% Y-o-YIndia’s largest primary aluminium producer with record-high annual output
1% Y-o-YRecord annual calcined Alumina production
48% Y-o-YRecord annual pig iron production
10% Y-o-YAverage gross operated production
16% Y-o-YOperational capacity
expanded by 1,300 MWAnnual Saleable production
3% Y-o-YHighest ever Ferro Chrome production
21% Y-o-YHighest ever Cathode production
14% Y-o-Y
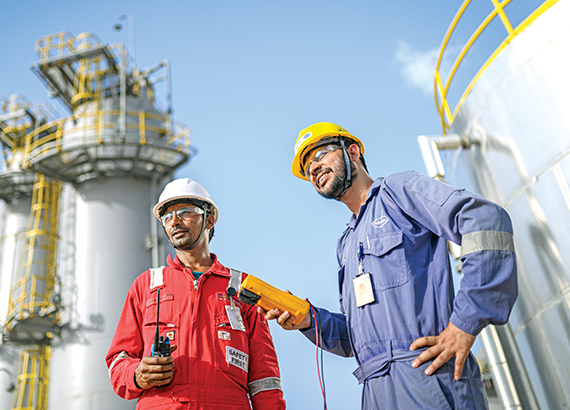
Knowledge, technology and innovation drive operational excellence and competitiveness. Ongoing investments in digital transformation, analytics and technology adoption strengthen efficiency, resilience and future readiness.
R&D Spend
Patents received in FY 2025-26
Patents under active application
Investment in digitalisation programmes
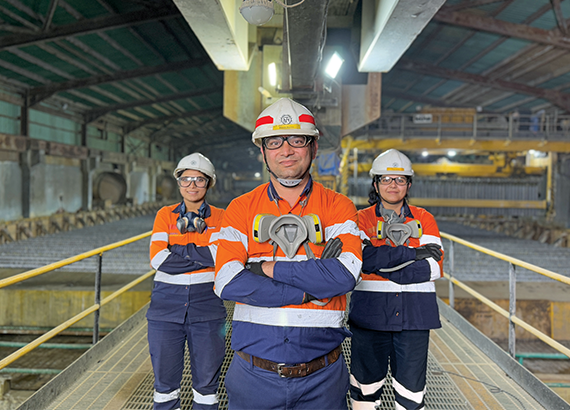
Our skilled workforce powers operational success and long-term growth. We invest in capability building, leadership development, health, safety and well-being, guided by a zero-harm philosophy. Inclusive practices foster collaboration, innovation and a high-performance culture.
Total Workforce
Women employees
Employees covered under mentoring and support programmes
Attrition rate
TRIFR - basis Full time employees
Transgender workforce

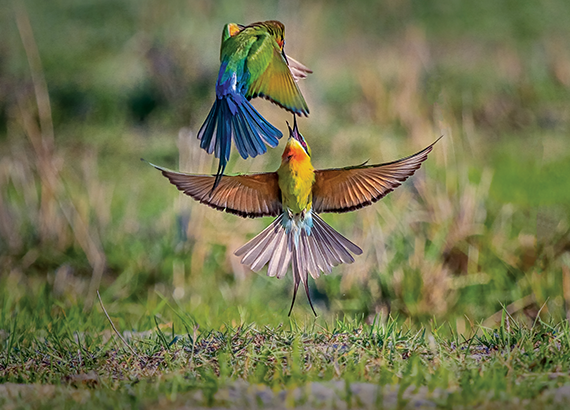
Our world-class resource base across India and Africa provides long-term operational visibility. Responsible resource management and environmental stewardship remain central to minimising ecological impact while generating sustainable social and economic value.
Combined R&R
Silver Reserves
Metal Reserves
Zinc-Lead metal R&R
Combined R&R
Gross proved, and probable reserves and resources
GHG Intensity
Water Positivity Ratio
HVLT waste recycled


Social and relationship capital
Strong stakeholder relationships built on trust and shared value reinforce our licence to operate. Continuous engagement with communities, partners and institutions supports responsible operations, strengthens reputation and enables effective strategy execution.
Key FY 2025-26 outcomes
12,769
Nand Ghars built
7.8 million
Total CSR beneficiaries
₹ 418.7 crore
Total CSR spend
31.09 million
Cumulative Women and children benefited from CSR programmes
5,926
Youth benefited from employment-based training