
The aluminium market on the LME witnessed considerable price fluctuations in FY 2025-26. In April 2025, aluminium prices were US$ 2,381 per tonne, rising to US$ 2,600/t levels in July due to 50% tariffs imposed by USA in June 2025. LME maintained steady uptrend till January 2026 rising to ~3,150/t levels due to various factors; China's production nearing the production cap of 45 MTPA, weakening of US Dollar, & frequent variations in tariffs from USA. The middle east conflict led smelter shutdowns propelled LME prices to multi-year highs of ~3,400 US$/t during March.
In CY 2025, global primary aluminium production was ~1.1% up from last year and around 73.8 million tonnes. The demand was also around at the same level with deficit balance of ~0.2 million. In the world excluding China, both production and consumption were at similar levels as per last year. China's production increased in CY 2025 was 44.2 MTPA. In India, the demand surged by ~10% to around 6 million tonnes in FY 2025-26.
The global demand for aluminium is anticipated to increase at a CAGR of ~2.5% from 2025 to 2030. Decarbonisation initiatives and a transition away from fossil fuels in the transportation sector will see an increase in aluminium consumption up to ~32 million tonnes by 2030. The demand for renewable energy will drive an increased demand for aluminium for solar panel manufacturing, transmission & distribution and the replacement of existing copper wiring in power distribution systems.
China, the world's largest aluminium consumer, shows promising signs of continued domestic consumption growth. However, its long-term success hinges on sustained growth in the transportation sector and modest recovery of the building & construction industry. For the Rest of the World, 2026 is expected to experience volatile market due to macroeconomic conditions like tariffs from USA, and geopolitical situations impacting trade flow & fuel and commodity prices and decrease in global production capacity due to expected shutdown of South32 Aluminium Smelter (Mozal) from March 2026.
Meanwhile, India stands out with its robust domestic demand outlook of more than 8% growth for FY 2026-27. Key sectors like electrical industry, automotive, and anticipated growth in renewables, defence and aerospace will continue to drive aluminium consumption in the country.
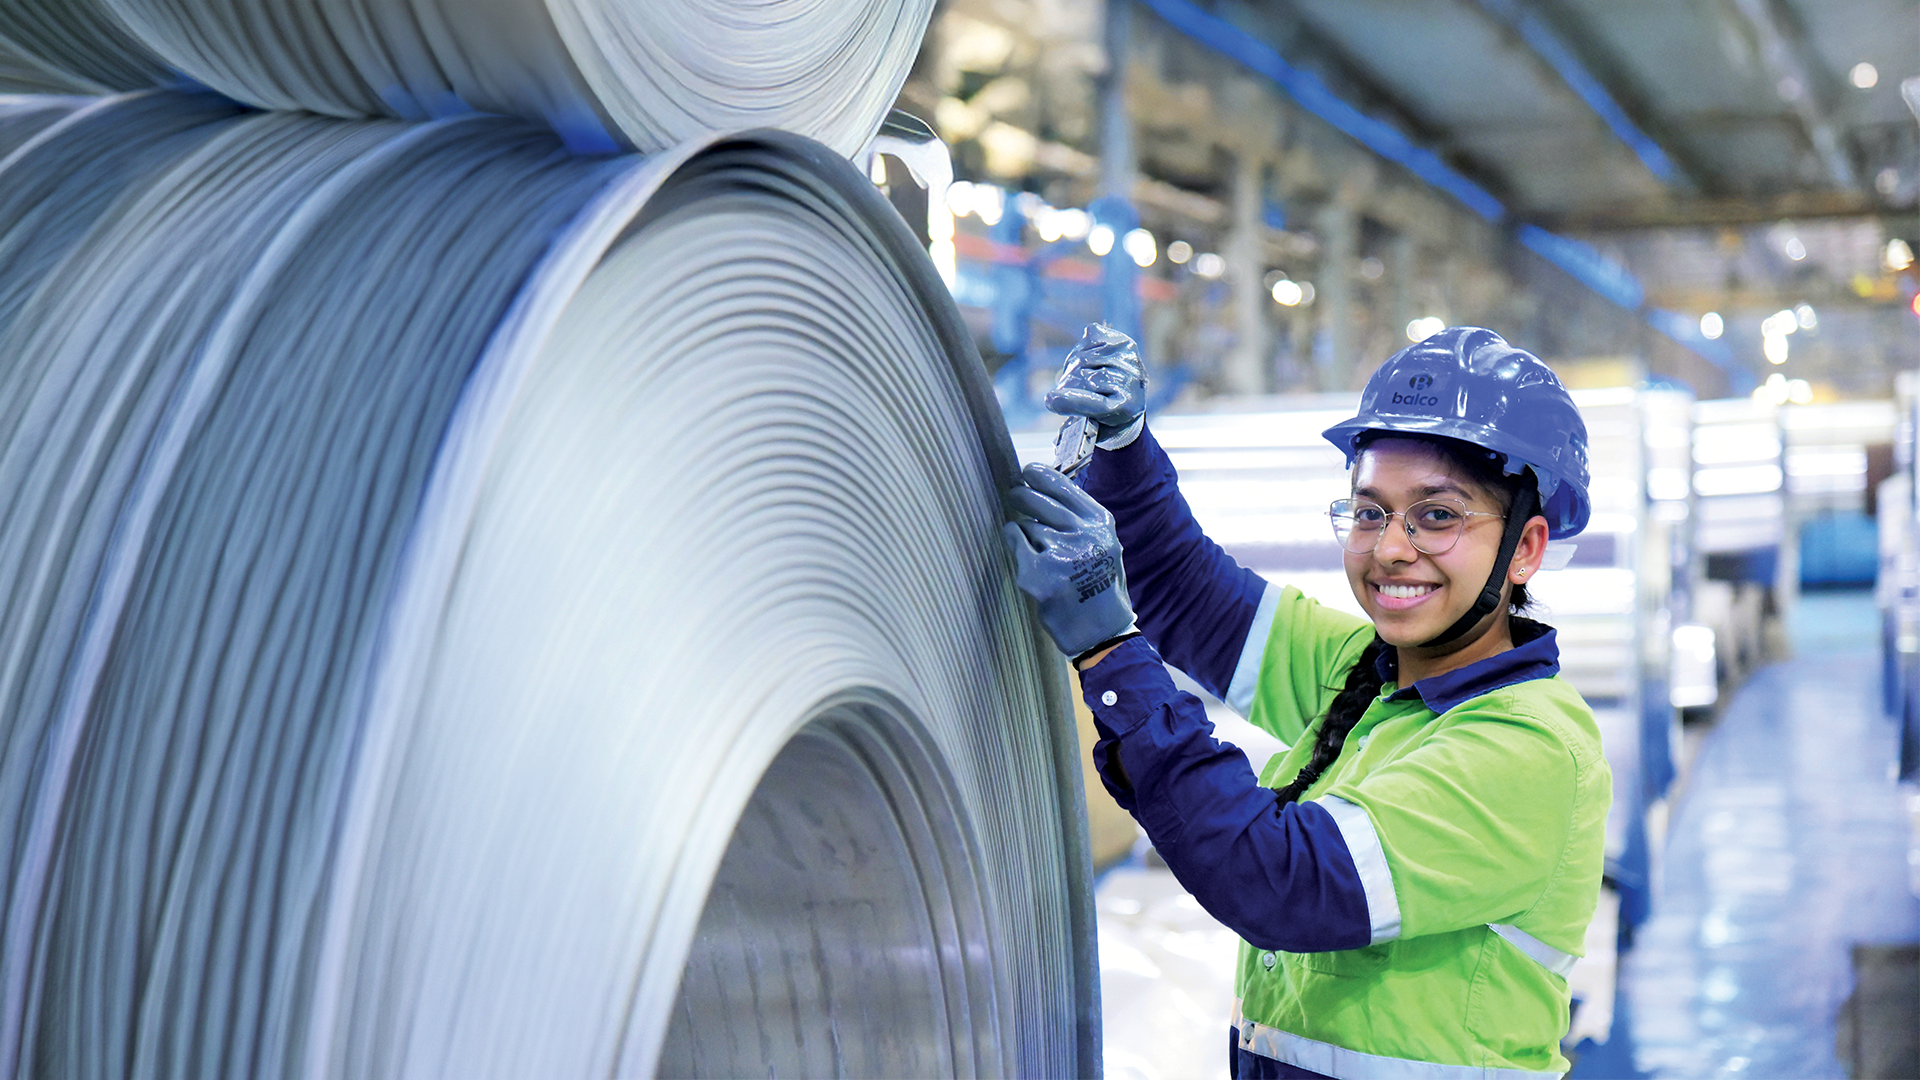
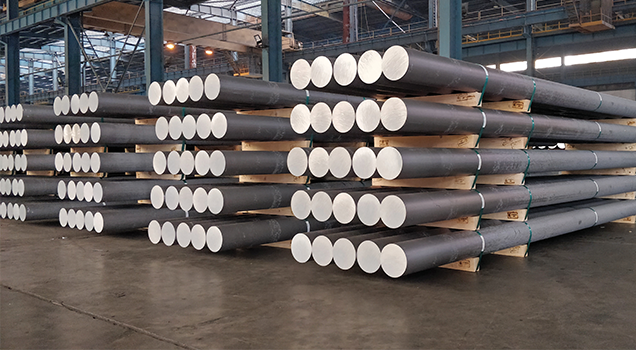
Vedanta is India’s largest primary aluminium producer with an annual capacity of ~2.4 million tonnes. The Company’s product portfolio includes aluminium ingots, primary foundry alloys, wire rods, billets, and rolled products which cater to varied industries globally such as energy, transportation, construction and packaging, aerospace and defence, among others. It has achieved domestic market share of 46%.
In line with the evolving market needs and the focus on value creation through expanding margins, the Company has been steadily increasing its value ‑added product (VAP) share in the portfolio which currently accounts for ~60% of its total global aluminium sales and targeting ~90%.

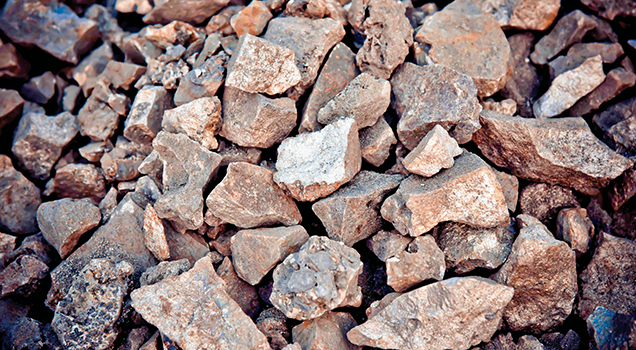
High Carbon Ferro Chrome (HCFC) is pivotal to the global stainless-steel industry, enhancing its non-corrosive, durable, and temperature-resistant qualities. Over 85% of HCFC production is dedicated to stainless steel manufacturing, indicating that a flourishing stainless-steel sector is a bellwether for strong HCFC demand.
Asia, with China at the helm, dominates the HCFC landscape, accounting for 85% of consumption and holding substantial chromite ore reserves, the essential raw material. Although South Africa is the premier chromite ore supplier worldwide, China’s leadership in HCFC production positions it as a dominant force in shaping global market dynamics and pricing structures.
India is playing a significant role in the HCFC market, securing the position as the world’s fourth-largest producer with an output of ~1.2 million tonnes in CY 2025. India’s HCFC market is characterised by an export orientation, with ~55% of its production being exported.
In Q4 FY 2025-26, Ferro chrome prices peaked at ₹ 1,24,000/T highest levels since September 2023. Demand in Q1 FY 2026-27 is primarily driven by exports which is supported by the exchange rate making exports much more lucrative as the domestic demand is expected to pick up gradually trailing the robust stainless steel prices.
With India’s solid domestic market and the anticipated global upswing in stainless steel production, the outlook for HCFC is optimistic. With increasing infrastructure initiatives in developing nations and an expected resurgence in demand from China, stainless steel production is projected to grow steadily by 4-5% in the upcoming year. This growth trajectory is set to catalyse HCFC demand worldwide, with production forecasts suggesting an increase of 3-4%.
India, however, is on track to surpass the global growth rate, emerging as the fastest-expanding market for both stainless steel and HCFC production. The projected 7-8% growth in Stainless Steel sector is propelled by the Indian government’s substantial investment in infrastructure development. Moreover, India’s per capita consumption of stainless steel is poised for a significant uptick, mirroring the expanding domestic HCFC market.
Ferro Alloys Corporation (FACOR) stands out in the domestic HCFC sector, ranking as the fourth-largest supplier amidst a predominantly export-oriented industry. In FY 2025-26, FACOR channelled almost all of its HCFC production to meet the needs of domestic stainless steel and alloy steel manufacturers.
Getting future-ready along with expansion, FACOR is also strategically augmenting its Value-Added Products (VAP) portfolio, thereby securing a competitive edge to serve specialised markets in Europe and South Korea. Looking forward to FY 2026-27, FACOR’s strategy is geared towards amplifying production volumes and expanding its market presence, both domestically and globally.
At our Ferroalloy business, our strategic emphasis remains on capacity expansion, prioritising domestic market, VAP development, and strategic international market expansion. We are ideally positioned to thrive in this dynamic market landscape.


In 2025, the global oil supply experienced moderate growth, primarily driven by both non-OPEC nations such as the United States (+0.76 Mb/d), Brazil (+0.37 Mb/d), Canada (+0.26 Mb/d), Kazakhstan (+0.27 Mb/d), China, and OPEC nations like Saudi Arabia (+0.49 Mb/d), UAE and Venezuela. Global oil demand also saw an upward trend, increasing by approximately 1.14 Mb/d. Sustained economic growth across Asia, driven by continued expansion in China, India, and other non-OECD countries, has been the primary catalyst for rising oil demand, fuelled largely by increasing transportation and industrial fuel consumption in these regions.
India’s oil demand in 2025 rose to 5.65 Mb/d (+0.1 Mb/d). It maintained strong growth driven by robust private consumption following GST reductions and sustained government spending. Monetary easing through rate cuts further supported growth momentum, though labour market pressures persisted.
Crude oil prices in 2025 averaged US$ 69.1 per barrel, marking a 14.5% decline from 2024. Monthly prices trended broadly downwards from US$ 79.2 in January to US$ 62.7 by year end, with a brief spike in June–July due to the US Iran conflict. The overall decline was driven by the unwinding of OPEC+ voluntary cuts and abundant supply from outside the group causing a supply glut. OPEC+ began reversing the reductions made in 2023 by fully restoring 2.2 mb/d of output by September and partially rolling back the remaining 1.65 mb/d later in the year. Despite this oversupply, geo-political events like Middle East conflict led to sudden spike in crude oil price to over US$ 100/bbl since March 2026.
OPEC forecasts global oil demand will grow by 1.4 Mb/d to reach 106.5 Mb/d in 2026. This increase will be driven by strong air travel demand, greater road mobility, including on-road diesel and trucking, and robust industrial, construction, and agricultural activities, particularly in non-OECD nations. Non-OECD production is expected to rise by 0.4 Mb/d in 2026, with growth led by the Latin American region (+0.4 Mb/d). Geopolitical factors, including the ongoing Middle East conflict and trade tariffs, could significantly impact global oil supply.
Brent crude oil prices have surged sharply following the outbreak of military conflict in the Middle East, rising more than 50% since the start of 2026. The U.S. Energy Information Administration (EIA) projects that Brent will average around US$ 79 per barrel in 2026, as the effective closure of the Strait of Hormuz temporarily reduces Middle Eastern oil production. Prices are expected to remain elevated through the second quarter of 2026, before easing below US$ 80 per barrel in the third quarter as production gradually resumes with the reopening of the Strait.
Manufacturing, business activity, air travel, and road mobility are expected to stay steady, while government initiatives such as Make in India, GST reforms, and the PMUY scheme will boost local demand. Strong GDP growth is also likely to sustain internal combustion engine vehicle sales amid slow EV penetration, pointing to a positive near-term outlook for oil product demand which is forecast to increase by 0.23 Mb/d to 5.9 Mb/d in 2026.
Cairn Oil & Gas, is one of the largest private oil and gas exploration and production companies in the country, has gross proven and probable reserves and resources of 1,321 million barrels of oil equivalent (mmboe). The company’s crude oil is sold to both public and private refineries, while its natural gas is consumed by the city gas distribution, fertiliser, and other industrial sectors in India.
In FY 2025-26, 100% of the company’s crude oil and natural gas production was sold within India, in accordance with government regulations.

India’s power sector witnessed significant advancements in FY 2025-26, highlighted by a record peak power demand of 245 GW, met with resilience and improved energy infrastructure. India’s power sector has shown strong growth, with electricity generation 1,830 billion units in FY 2024-25 and 1,848 billion units in FY 2025-26, witnessing 1% Y-o-Y growth. Capacity additions were robust at 12%, bringing total installed capacity to 533 GW in FY 2025-26 compared to 475 GW in FY 2024-25. Notable strides were made in renewable energy, with an additional 55 GW capacity added in FY 2025-26, and 7G W coal-based plant capacity addition in same period to meet rising demand. As per CEA, India is projected to witness coal (including lignite) installed capacity requirement of 291 GW by FY 2031-32 to meet round the clock power demand.
With initiatives like universal electrification, improved rural power availability, and enhanced energy conservation efforts, India is on a robust path to becoming a global energy leader.
India’s power sector is experiencing rapid growth, driven by several key macroeconomic factors. As per World Economic Forum, the country’s population is projected to reach 1.515 billion by 2030, with urbanisation accelerating the demand for electricity. Notably, India’s per capita electricity consumption has surged to 1,460 kWh in 2024-25, which is estimated to reach 2,000 kWh by 2030 and 4,000 kWh by 2047.
For the year 2035-36 India has set an ambitious electricity generation target of 3596 billion units, reflecting a 95% increase from the 1,848 billion units generated in the 2025-26. The 2025-26 generation mix includes 1,307 billion units from thermal power, 175 billion units from solar power, 167 billion units from large hydro power and 55 billion units from nuclear.
Fossil Fuel based plants, primarily fueled by coal and lignite, now account for 249 GW of installed capacity, making up 46.8% of the total generation capacity. Meanwhile, non-fossil fuel sources, such as renewable energy and nuclear power, contribute 283 GW of installed capacity.
In India, rural average daily supply increased from 12.5 hours in FY 2013-14 to 22.6 hours in FY 2024-25, while urban areas also saw improvement, with daily average supply rising from 22.1 hours to 23.4 hours over the same period. This highlights significant progress in the reliability and reach of the country’s electricity infrastructure.
Round-the-clock (RTC) tariffs for power in the Day Ahead Market (DAM) for FY 2025-26 are set at ₹ 3.8 per kWh, reflecting ongoing stability in the power pricing landscape.
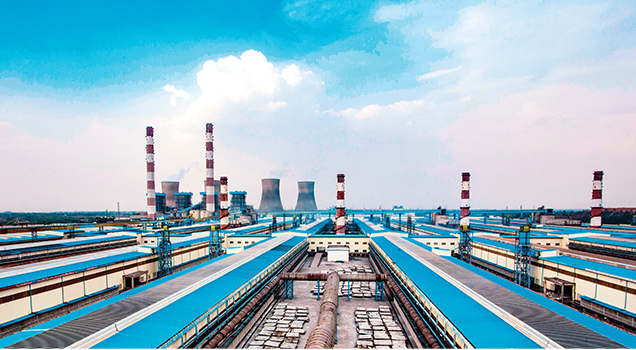
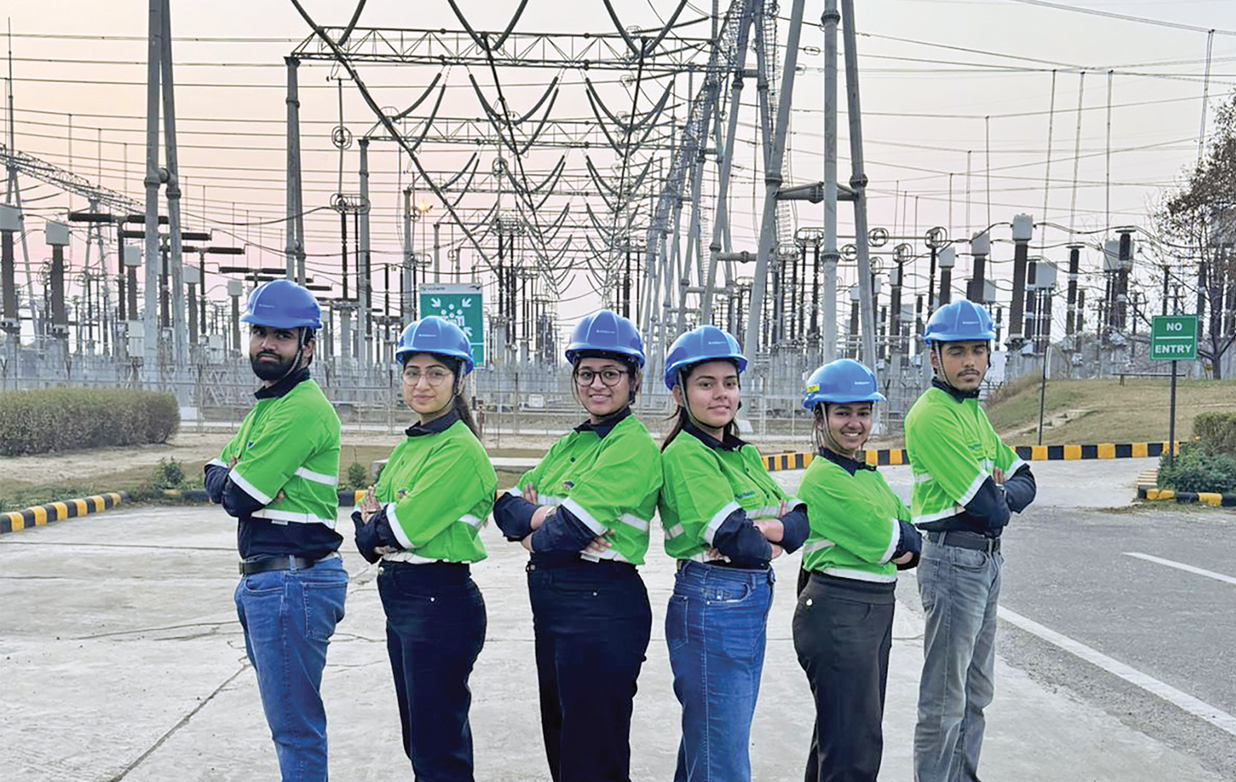
Vedanta Power is strategically positioned to capitalise on the expanding power market. With operational merchant thermal power capacity of 4.2 GW, the company is 5th largest private thermal player. Key assets include Talwandi Sabo Thermal Plant (1,980 MW), Sakti Thermal Plant (600 MW operational, 600 MW in Project), Meenakshi Energy (1,000 MW) and Jharsuguda Thermal Plant (600 MW).
Talwandi Sabo Thermal Plant and Jharsuguda Thermal Plant have entire capacity tied up to PSPCL and GRIDCO respectively with fuel linkage secured for reliable PPA power supply. In FY 2025-26, Vedanta Power operationalised 1-,000 MW of Meenakshi Energy and 600 MW (out of 1,200 MW) of Sakti Thermal Plant in Q2FY 2025-26. Vedanta Power secured 500 MW medium-term PPA with TNPDCL, of which Meenakshi Energy secured 300 MW and Sakti Thermal Plant secured 200 MW. The mix of Merchant and PPA power supply in these newly commissioned units provide Vedanta Power with a blend of secured revenue and maximisation of market rates.
Vedanta Power secured 5.34 million metric tonnes of linkage coal for the new assets, Meenakshi Energy (2.64 million metric tonnes) and Sakti Thermal Plant (2.7 million metric tonnes).
MEL is strategically located near to Krishnapatnam Port and is designed to operate with a blend of imported and domestic coal. In recent times, due to fluctuating imported coal cost and supply uncertainty, MEL is transitioning to accommodate higher domestic coal consumption with minimum technical modifications. This transition to domestic coal will ensure that MEL benefits from both domestic and imported coal based on optimal costing. To achieve higher domestic coal consumption in MEL, there is capex investment based on internal and expert study.
Talwandi Sabo Thermal Plant cofired 5.21% biomass in FY 2025-26 improving local livelihood and supporting India’s decarbonisation agenda.
Sakti Thermal Plant is in close proximity to coal mines thereby supporting competitive cost of generation. Sakti Thermal Plant Unit 2 of 600 MW is expected to be synchronised in H2FY 2026-27 and thereby commission full capacity of 1,200 MW by 2027.

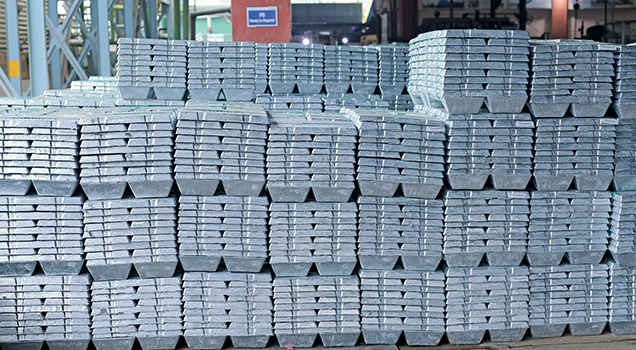
In FY 2025-26, the zinc price stayed buoyant, touching peak of US$ 3,487 per tonne, the highest level since February 2023, and averaging at US$ 2,970 per tonne, a 3% Y-o-Y increase. The rally was supported by tight physical inventories and strong consumption in galvanising and infrastructure segments, alongside rising geopolitical concerns and a weakening dollar.
In CY 2024-25, global zinc demand surged by 0.6% Y-o-Y to 13.66 Mnt, driven by rapid urbanisation, renewable energy (RE) transition, and structural consumption drivers in end-use markets.
In China, the demand was weighed down by weak real estate, partially offset by growth in automotive and appliances. Europe witnessed 2% consumption growth as auto production stabilised despite sluggish construction. In the US, steady steel mill utilisation, tariff developments, and firm non-residential construction supported galvanised steel demand, with a potential upside from continued steel and auto sector momentum.
Galvanising is the dominant zinc application, accounting for 60% of the total use driven by its critical role in construction, transport, and infrastructure. These diverse and critical end-uses reinforce zinc’s relevance and resilience across economic cycles.
India remained a major global driver of zinc demand, with consumption rising from 814 kt in CY 2024 to 851 kt in CY 2025, supported by broad industrial and infrastructure growth. This was reflected in the India Manufacturing Purchasing Managers’ Index (PMI), averaging around 58 in CY 2026, and Index of Industrial Production (IIP), peaking in December 2025 with a growth of 7.8%, translating into higher demand for galvanised steel, zinc alloys, castings and chemicals.
Government programmes such as Gati Shakti and the National Infrastructure Pipeline, along with strong steel and cement demand, continue to sustain galvanising requirements across transport, power, housing, and utilities. Road and rail modernisation alone generates a large part of the demand for galvanised steel structures.
Recently, energy transition investments, including in solar and wind installations, power grid expansion, and transmission towers, have emerged as significant drivers of galvanised steel structures. Simultaneously, rising auto and appliance production continue to boost demand for galvanised structures and zinc die cast components, with emerging applications in zinc-based batteries and specialised zinc products. Favourable trade dynamics and new export opportunities are further reinforcing India’s role as a strategic zinc supply hub, supporting smelter throughput and domestic availability.
As per Wood Mackenzie, global zinc demand in CY 2026 is expected to grow at 1% Y-o-Y to 13.80 Mnt, supported by marginal increases in China, stabilising European consumption, and a stronger US steel linked demand. Mine supply is expected to remain tight, with output projected to fall by 4.1% Y-o-Y to 12.39 Mnt due to significant production cuts and the absence of major new project additions, resulting in consistently low treatment charges. Prices are forecast to average at c. US$ 3,064 per tonne in CY 2026, supported by low refined stocks and a softer US dollar, before gradually easing towards US$ 2,800 per tonne from CY 2026-27 onwards as refined stocks accumulate due to increased utilisation of China’s new smelting capacity.
Over the medium term, the global mine output is expected to plateau by CY 2028 and begin declining from CY 2029 onwards as the pipeline of advanced stage projects remains thin.
India and Southeast Asia are expected to account for the bulk of incremental demand for refined zinc. With India targeting 300 Mnt of crude steel capacity by 2030, aligned with the National Steel Policy and long-term sectoral growth plans, the domestic zinc demand is forecasted to grow proportionately. This provides a strong foundation for our ambitious growth plan to double capacity.
Hindustan Zinc, the world’s largest integrated zinc producer and India’s only primary zinc manufacturer, held a 74% domestic primary market share in FY 2025-26 with 600 kt of domestic zinc sales. Value-Added Products (VAP) stood at 184 kt, contributing to c.22% of total sales. Around 70% of refined zinc was sold within the domestic market, while 30% was exported to South East Asia, the Middle East, the US, and Europe.
We continued to progress towards our ambition of 100% online price discovery (OPD) sales, achieving 95% OPD sales in FY 2025-26. The launch of Zinc Moolya, a rupee-linked live pricing module in January 2026, further enhanced price transparency and simplified transactions for micro, small and medium enterprises (MSMEs).
FY 2025-26 marked a breakthrough year for commercial scaling of EcoZen, Asia’s first low carbon zinc brand with a carbon footprint of less than 1 tCO2e per tonne. We signed Memorandums of Understanding (MoUs) with Tata Steel and Silox India Limited and delivered EcoZen, reinforcing efforts to accelerate its adoption across galvanising operations.
We signed MoUs with CMR Group and Tripura Group to operationalise manufacturing units at our upcoming Zinc Park in Khankhala, Rajasthan. These collaborations represent a key step towards building India’s first integrated downstream hub for zinc based industries that is scalable, efficient and sustainable, supported by assured raw material linkage and long-term offtake commitments. This initiative will help attract new investments, foster MSME growth, generate local employment, and accelerate Make in India manufacturing near our operations at Chanderiya, Dariba and Debari.

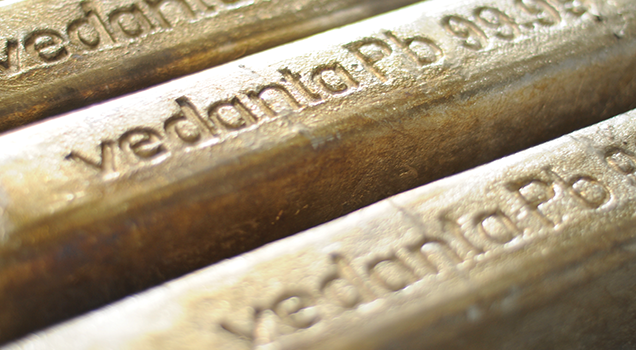
Lead prices softened during FY 2025-26, averaging at US$ 1,954 per tonne and settling below US$ 1,900 per tonne. This was due to adequate supply in the market rather than weakening demand. In CY 2025, global refined lead production increased by 1% to 14.35 Mnt, while primary mine output increased by 3.4% to 4.44 Mnt.
In CY 2025, global refined lead demand surged by 0.5% Y-o-Y to 14.24 Mnt. This was mainly driven by strong automotive battery demand across both original equipment manufacturers and replacement markets, expansion in stationary battery applications across data centres, telecom and grid storage, and robust growth in Asia.
Lead demand continues to be anchored in starting-lighting-ignition (SLI) and auxiliary batteries across global internal combustion engines (ICE) and hybrid fleets, as well as energy storage and backup power applications. Factors like rising hybrid registrations in Europe, regulatory tightening on low voltage lithium ion batteries in China, and sustained growth in two- and three-wheeler mobility and telecom/backup power applications in India continue to reinforce its demand. Its recyclability of over 95% makes enhances its sustainability profile, while its role in enabling cost-effective, large-scale energy storage supports RE integration and global energy security.
India’s total lead consumption for FY 2025-26 stood at 1.36 Mnt, majorly driven by batteries, cables, and galvanisers, etc. Indian lead demand is supported by batteries for automotive and energy applications, with overall consumption increasing due to its wider use in SLI batteries, cable sheathing, and PVC stabilisers. It also finds application in sectors like defence systems, telecommunications, railways, logistics, and industrial backup power.
Global refined lead demand is projected to grow steadily by 2.2% Y-o-Y to 14.56 Mnt in CY 2026, supported by stable automotive and stationary battery applications. China’s refined lead demand is expected to reach 6.34 Mnt in CY 2026, supported by strong new energy vehicle (NEV) related battery exports and industrial use. Against this, the global primary mine output is expected to shrink by 4.1% Y-o-Y to 4.25 Mnt with limited new project additions keeping concentrate markets tight.
Hindustan Zinc strengthened its position as India’s leading lead producer, increasing its domestic primary market share to 90% in FY 2025-26, up from 74% in FY 2024-25. This was supported by long-term contracts with large battery manufacturers in India, which secured a stable and consistent offtake. Over 80% of our refined lead production, translating into 157 kt was sold domestically, with 50 kt in exports. The production was focussed on 99.99% purity lead ingots, registered with the London Metal Exchange, with efforts underway to optimise sales mix towards 100% domestic consumption by securing new customers and enhancing lead applications.

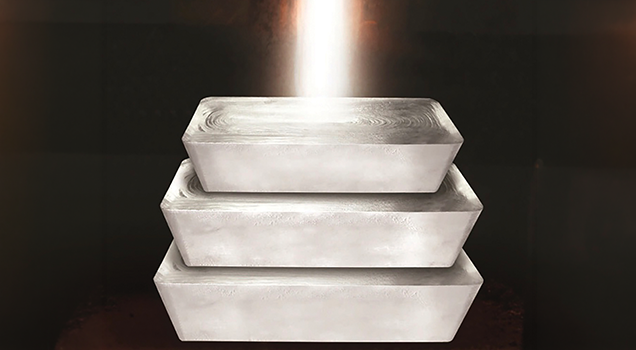
Silver prices rallied to record highs during FY 2025-26, touching historic highs of US$ 118.45 per toz in January 2026, and averaging US$ 53.09 per toz, up 75% Y-o-Y. This spike was driven by record exchange traded product (ETP) inflows, record tight market conditions, and heightened tariff and policy uncertainty in the US. Further, strong physical/investment demand that re routed metal into US vaults while tightening availability in London, a compression of the gold-to-silver ratio below 72, and its new designation as a US critical mineral led to strategic stockpiling.
Silver demand is being structurally redefined by high-growth sectors such as AI infrastructure, 5G, and EV components. These emerging applications, alongside India’s massive bullion imports of over 6,000 tonnes outstripped industrial substitution efforts. As a result, industrial fabrication hit a new all-time high of c.700 Moz, offsetting the decline in photovoltaic demand caused by aggressive thrifting as manufacturers reacted to silver’s price surge.
Global mine output remained stagnant at 813 Moz due to declining ore grades and operational challenges across mines. The market recorded its fifth consecutive deficit of 95 Moz in CY 2025 as total supply rose by only 1% Y-o-Y to 1,022 Moz, while demand reached 1,117 Moz. This persistent shortfall has resulted in a cumulative five-year deficit of over 820 Moz, severely depleting above-ground inventories.
India’s silver demand reached an exceptional high of 7,000 MT in CY 2025, underscoring the country’s position as the largest consumer of silver globally, with usage driven across industrial, investment, and fabrication sectors.
Domestic markets experienced notable tightness throughout CY 2025 due to strong technology linked consumption (solar manufacturing, EV production, electronics, and semiconductor), festive buying, and heavy investor accumulation. This resulted in periodic physical shortages as demand consistently outpaced available supply, while positioning silver as an essential material in India’s clean energy and high tech growth story.
Investor behaviour shifted dramatically towards silver, with buyers accumulating metal even at record high price levels. ETF inflows, bar and coin purchases, and minimal scrap selling highlighted strong confidence and created sustained upward pressure on physical demand.
Global silver supply is forecasted to reach a decade high of 1.05 billion ounces in CY 2026, up 1.5% Y-o-Y, driven by a surge in recycling and a modest rise in mine output to 820 Moz. While Mexico remains the leading producer, a long-term decline towards 186 Moz is anticipated by CY 2029 due to maturing legacy assets.
Hindustan Zinc is the only primary silver producer in India and is amongst the top 10 silver producers globally. Over the past two decades, we have delivered a remarkable 20x growth in silver production, and its contribution towards overall profitability increased to c.45% in FY 2025-26. We showcased a robust sales performance of 627 MT in FY 2025-26, with 100% sales in the domestic market.

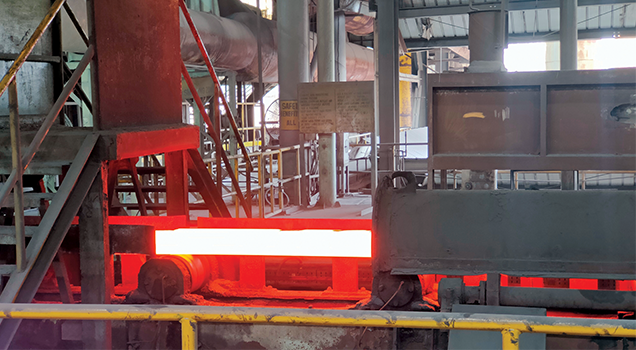
The global iron ore market remained resilient during FY 2025-26, supported by steady steel production and sustained infrastructure investments across major emerging economies. While China's steel demand continued to face structural headwinds from the prolonged correction in its property sector, demand across India, Southeast Asia and other developing markets remained robust, helping offset weakness in mature economies.
According to the World Steel Association, global steel demand is expected to bottom out and return to modest growth, supported by public infrastructure spending, manufacturing investments and easing financial conditions. Developing economies, particularly India, continue to be the key drivers of steel consumption growth.
Iron ore prices remained volatile during the year, largely influenced by Chinese economic stimulus measures, inventory movements and global supply dynamics. Benchmark seaborne iron ore prices broadly traded around the US$ 90–110 per tonne range, reflecting the balancing effect of softer Chinese steel demand and resilient consumption across emerging markets.
The medium-term outlook for iron ore remains constructive. Global steel demand is expected to gradually recover, supported by infrastructure-led growth, manufacturing investments and energy transition-related projects. While excess steelmaking capacity and trade-related uncertainties continue to pose challenges globally, India is expected to remain the most significant source of incremental steel and iron ore demand.
With sustained investments in roads, railways, urban infrastructure, renewable energy and industrial manufacturing, India is expected to play an increasingly pivotal role in shaping global steel and iron ore markets over the coming decade.
The Company has solidified its position as a key player in the production of iron ore and pig iron, serving the steelmaking, construction, and infrastructure industries. With a strategic focus on optimising its mining operations, the Company has achieved significant production milestones. Sesa Goa is one of the largest private sector exporters of iron ore in India. Our total iron ore saleable production through IOK and IOG Mines is 6.5 million DMT, 5% up Y-o-Y. Pig iron production is at the highest levels with 895 kt production in FY 2025-26.

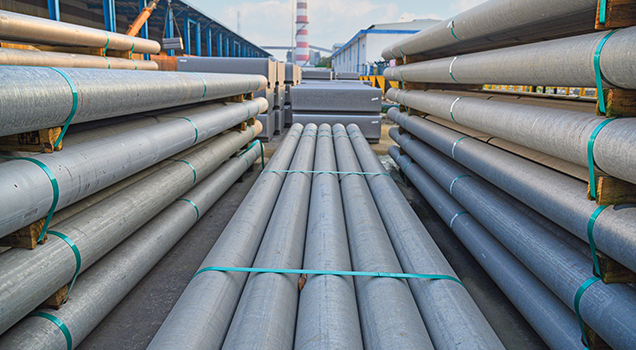
India further strengthened its position as the world’s second-largest crude steel producer during FY 2025-26, with crude steel production reaching approximately 169 million tonnes, representing growth of over 11% Y-o-Y.
Global steel markets remained challenged by excess capacity, weak demand in certain regions and continued exports from China. However, policy measures implemented by the Government of India helped moderate import pressures and support domestic producers. Following the imposition of safeguard measures on select steel imports, finished steel imports declined significantly during FY 2025-26, while exports recorded strong growth.
India’s steel demand is projected to remain robust, supported by sustained momentum across core consuming sectors such as infrastructure, construction, housing, automobiles and engineering. The World Steel Association forecasts a 9% annual growth in India’s steel consumption through 2025 and 2026, driven primarily by large-scale public capex and accelerating urban development.
Further, the Union Cabinet’s recent decision to extend and restructure the Jal Jeevan Mission (JJM) until December 2028 with an enhanced outlay of ₹ 8.69 lakh crore – strengthens demand visibility for DI pipes.
ESL Steel Limited or ESL is an integrated steel plant situated in Bokaro, Jharkhand, with a design hot metal capacity of 3.5 MTPA. Its current operating hot metal capacity is 1.5 MTPA with a diversified product portfolio of Wire Rod, Rebar, DI Pipe and Pig Iron which are sold across key sectors such as construction, infrastructure, transportation and energy.
ESL achieved hot metal production of 1.384 million tonnes down 3% Y-o-Y and saleable production of 1.301 million tonnes down 3% Y-o-Y primarily due to the maintenance activities in one of the furnaces and subdued demand in the DI pipe segment. Also, ESL achieved the highest-ever annual production of Billet, TMT and Wire rod in the history of ESL.
The key strategic priority remains increasing our hot metal capacity from 1.5 MTPA to 3.5 MTPA by FY 2026-27 and downstream expansion in further years. This strategic capacity enhancement aligns with our vision to become a high grade, low cost steel producer, operating with the highest standards of environment, health and safety, while serving India’s growing requirement for quality steel products.


