Fostering human capital
Our goal is to create a meritocratic organisation that empowers employees to take the right business decisions by providing an open, safe and motivating work environment. We commit to fostering an environment that encourages learning and growth and enables us to build a next-generation organisation with a focus on promoting innovation, delivering business value and driving thought leadership.
Key HR priorities
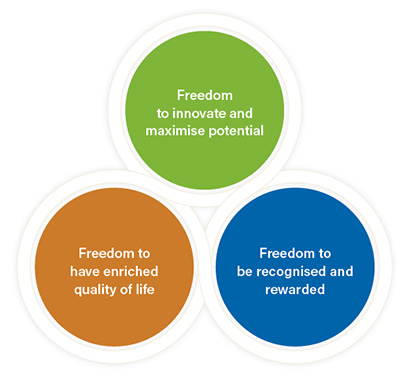
Freedom to have enriched quality of life
We prioritise employee care via introducing multiple initiatives that cater to the wellbeing and health of our employees and their families.
Freedom to learn and grow and freedom to innovate and maximise potential
We ensure holistic development of our employees by providing them with opportunities to grow. As a part of our structured drive, we identify high calibre individuals and provide them with high impact roles and autonomy that challenges their potential. Through this we try to bring out the best in them, thereby fostering innovation and continuous learning.
Freedom to be recognised and rewarded
We consistently recognise our employee efforts in business and those going beyond duty hours during the pandemic period for community development and care. Providing our people with wealth creation opportunities to grow along with the organisation has been a long-standing unique selling point of Vedanta. Targeted incentive schemes are launched to reward our superlative performers.
FY2022 Workforce snapshot
| Buisness | Location | Full-time employees | Contract employees | Retainers | Total workforce | Total | ||||
|---|---|---|---|---|---|---|---|---|---|---|
| Male | Female | Male | Female | Male | Female | Male | Female | |||
| Aluminium | India | 4,710 | 608 | 20,303 | 711 | 10 | 1 | 25,023 | 1,320 | 26,343 |
| Copper | Australia | 18 | 2 | 0 | 0 | 0 | 0 | 18 | 2 | 20 |
| UAE | 49 | 6 | 24 | 0 | 0 | 0 | 73 | 6 | 79 | |
| India | 497 | 91 | 840 | 80 | 3 | 0 | 1,340 | 171 | 1,511 | |
| Iron ore & Steel (includes ports) | India | 3,973 | 272 | 10,481 | 215 | 3 | 0 | 14,457 | 487 | 14,944 |
| Facor | India | 470 | 23 | 1,869 | 0 | 3 | 0 | 2,342 | 23 | 2,365 |
| Oil & Gas | India | 1,125 | 226 | 0 | 0 | 121 | 7 | 1,246 | 233 | 1,479 |
| Power | India | 46 | 21 | 1,340 | 34 | 0 | 0 | 1,386 | 55 | 1,441 |
| HZL | India | 3,139 | 425 | 19,060 | 93 | 5 | 1 | 22,204 | 519 | 22,723 |
| VZI | Namibia | 0 | 0 | 0 | 0 | 0 | 0 | 0 | 0 | 0 |
| South Africa | 798 | 191 | 3,027 | 383 | 22 | 12 | 3,847 | 586 | 4,433 | |
| Corporate Offices | India | 73 | 97 | 3 | 10 | 22 | 5 | 98 | 112 | 210 |
| Total | 14,898 | 1,962 | 56,947 | 1,526 | 189 | 26 | 72,034 | 3,514 | 75,548 | |
NATIONALITY DATA
| Nationality | Full-time employees | % |
|---|---|---|
| Indian | 15,787 | 93.6% |
| South Africa | 1,014 | 6% |
| Australia | 28 | 0.06% |
| Nepal | 10 | 0.12% |
| Other | 21 | 0.22% |
| Total | 16,860 | 100% |
| % WOMEN IN WORKFORCE | FY2022 |
|---|---|
| Total women workforce | 11.64% |
| Women in all management positions | 15.15% |
| Women in junior management positions | 16.20% |
| Women in senior management | 7.72% |
| Women in STEM related positions | 10.14% |
| Proportion of senior management hired from the local community | FY2022 |
|---|---|
| The number of senior management hired from the local community (FTE) | 24 |
| Full-time employees of senior management | 310 |
| % | 8% |
| Data breakdown of new hires | < 30 Yrs | 30 - 50 Yrs | > 50 Yrs | Total | ||||||||
|---|---|---|---|---|---|---|---|---|---|---|---|---|
| Male | Female | Total | Male | Female | Total | Male | Female | Total | Male | Female | Total | |
| New hires | 738 | 405 | 1,143 | 246 | 43 | 289 | 27 | 6 | 33 | 1,011 | 454 | 1,465 |
| Average hiring cost for FY22 – ` 94,918 | ||||||||||||
| Open positions | 562 | |||||||||||
| Open positions filled by internal candidates in FY2022 | Positions filled by internal candidates | 368 | ||||||||||
| Percentage positions filled by internal candidates | 65.48% | |||||||||||
Anti-harassment policy
We aim to create and maintain a work environment in which people are treated with dignity, decency and respect – an environment characterised by mutual trust and the absence of intimidation, oppression, and exploitation, free of discrimination or harassment of any kind. Through the implementation of this policy and by educating, mentoring and guiding our employees, we seek to prevent, correct, and discipline behaviour that violates this policy. All employees, regardless of their positions, are covered by and are expected to comply with this policy and to take appropriate measures to ensure that prohibited conduct does not occur.

TALENT DEVELOPMENT
To maintain our competitive edge, we take a multidimensional approach to recruiting, retaining and training individuals. We are constantly upgrading our talent management cycle through the adoption of latest technologies and adoption of best-in-class people practices. We hire from top campuses and induct specialised talent from focused new-age programmes including digital, data science and analytics, sustainability, R&D among others.
More than 1,000 young professionals have been hired from top-tier academic institutions from around the world for entry- and mid-level positions.
Along with hiring experts in senior positions, we also believe in creating leaders from within. Over the last year, nearly 70% of open positions have been filled by internal candidates through initiatives such as V-Reach, Internal Job Posting (IJP) and Act-up programmes, among others. V-Reach, V-Aspire, V-Reach Tech, Chairman’s Young Leaders Programme, and Vice Chairman’s SBU Engagement Workshops form a set of multi-dimensional programmes to identify and give opportuity to top talent within the organisation.
As a part of our drive towards building a strong talent pipeline and focusing on individuals who have significantly contributed to Vedanta’s stellar growth over the years, we also have a strong re-hiring project in place. Through these initiatives, we ensure a robust pipeline of successors who will take the place of the leaders in key positions as per need.
We have multiple central and BU-level learning and development programmes in place for knowledge dissemination of these top talents. Gurukul is Vedanta’s first-ever Group-wide digitally driven platform that promotes sharing of knowledge as well as the generation of innovative ideas.
`1,21.38 million
EXPENDITURE ON TRAINING AND
DEVELOPMENT OF EMPLOYEES
Launch of the ESG academy
If Vedanta is to integrate ESG-thinking across all its employees and business-partners, there needs to be a way to enhance their understanding on the subject. The ESG Academy has been envisioned as a one-stop-learning-hub for all ESG/sustainability related learning. We plan to partner with leading academic institutes to develop this industry-leading learning hub for ESG.
In FY2022, we kick-started the capacity-building process by enrolling Vedanta’s top 100 leaders in Sustainability 101 sessions. This 8-hour workshop took the participants through all aspects of ESG through an interactive training programme. All participants who took this training are now L1 Certified ESG Professionals.
In FY2023, we plan to roll this out to 100% of our employees and business partners via an online training module.
Total training in person hrs/days
| FY2022 | Male | Female | Total |
|---|---|---|---|
| Total training hours – full time employees (FTE) | 347,660.12 | 66,138.66 | 413,798.78 |
| Average training hours for FTE | 23.34 | 33.71 | 24.54 |
| Average amount spent per FTE on training and development 7,319 | |||
| EMPLOYEE TRAINING- HSE | FY22 |
|---|---|
| Total Training Hours - Full-time Employees (FTE) | 91,284 |
| Average Training Hours for FTEs | 5.41 |
Key Learning and Development programmes
- V-Excel initiative provides each of our new hires a single digitally-driven platform; this platform enables them to perform by providing the right anchoring, continuous engagement and recognition of exceptional talents at an early stage of their career
- To enhance our millennial outreach and strengthen our campus engagement, we have launched XStrat, which is a comprehensive case study completion programme in top colleges across India. The first edition of this competition saw over 6,000 students participate from 30+ B-Schools
Management ACT-UP
At Vedanta, we have a structured process to identify and nurture high performers and develop leaders of tomorrow. Through rigorous training and grooming, they absorb the necessary values and skills to take on responsibilities, keeping us future ready. Aligned with this practice, we have launched Management ACT-UP – an industry-leading global leadership identification and development programme.
Launched in 2021, it engaged 1,800 senior leaders across the Group, from whom 400 were shortlisted after a detailed assessment. All 400 leaders were put through a rigorous online psychometric and leadership assessment that helped further shortlist 230 participants, who had the unprecedented opportunity to showcase to an exclusive panel their ideas on how they could contribute to the Group’s critical business priorities including ESG, People Development, Cost & Volume and Digital & Innovation, among others and promote their personal aspirations. The panel comprised of industry stalwarts, Board members of reputed organisations and key subject matter experts, who provided their own unique outside-in perspective.
Over four weeks of panel evaluations and discussions with the senior management, including Chairman, Vice Chairman, Group CEO, Business CEOs, Functional CXOs, around 100 leaders were identified to take up higher roles across Vedanta.
Management ACT-UP does not end here. The identified leaders will go through a high impactful learning and development journey at top global and Indian institutes, which will sharpen their skills and hone their leadership acumen.
Of the 100 leaders identified through Management ACT-UP:
40%
HAVE MOVED ACROSS BUSINESS
AND LOCATIONS
50%
HAVE BEEN PLACED IN SBU
LEADERSHIP/DEPUTY AND
SHADOW ROLES
51%
HAVE BEEN IDENTIFIED WITH
FUTURE CXO POTENTIAL
The Graduate Engineer Trainee Development
The Graduate Engineer Trainee Development is a flagship programme helping the new employee shape into professionals and enable them to deliver high performance. This programme follows the 70:20:10 learning principle. This one-year programme consists of 5-6 weeks of classroom training on safety, behaviour, management, operation, and maintenance. The remaining period is for structured on-the-job training, action learning projects using the Six Sigma framework, and leadership programmes. This initiative focuses on modifying the working methodology and creating a culture of structured problems through data validation and root cause analysis. The training development programme was developed in partnership with ASQ (American Society For Quality) to get the executives certified in Lean Six Sigma through structured assessments. 2 Six Sigma Projects completion were exclusively mentored by senior leaders & experts. Six Sigma initiative resulted in an annual savings of around US$300 million.

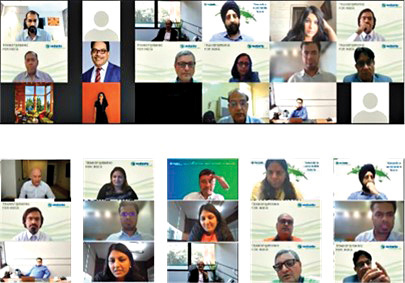
EMPLOYEE ENGAGEMENT
To keep our people involved and motivated, we have been creating unique engagement programmes for them. There are two well established major employee studies that help us gauge employee engagement – Great Place to Work (GPTW) and Kin centric Best Employer Study.
Great Place to Work
GTWP follows a ‘trust model’ concept, where a great workplace is defined through the trust employees have for the people they work for, feel pride in what they do and enjoy the company of people they work with. Top research institutions and business leaders see the trust model as the definitive standard to assess the workplace.
Most of our subsidiaries scored well above the industry mean as per GPTW’s ‘Trust Index Grand Mean’. Culture wise, all our subsidiaries fall under ‘Good’ or the ‘Best’ culture according to the industry benchmark. About 57-84% of our employees are in the ‘citizen’ category as per the survey which reflects their active engagement in work and the organisation. We also score highly in ‘Management Competencies’ and ‘Pride’. However, we have scope to improve in terms of ‘work-life balance’, ‘job security’ among others.
GPTW employee engagement (% of actively engaged employees)
| FY2019 | FY2020 | FY2021 | FY2022 | |
|---|---|---|---|---|
| Vedanta Group Avg Score * | 75.32 | 73.8 | 77.75 | 79.5 |
*The scope of assessment is below:
| FY2019 | FY2020 | FY2021 | FY2022 |
|---|---|---|---|
| Cairn, VAL-J, HZL | Cairn, VAL, HZL | VAL, Cairn, HZL,TSPl, IOB, ESL, | VAL, Cairn, HZL,TSPl, IOB, ESL Sterlite Copper and FACOR |
| 21.82% of FTE | 62.76% of FTE | 85.22% of FTE | 93.13% of FTE |
Results of survey by age for FY2022
| Age Group | Average Score |
|---|---|
| < 25 years | 76 |
| 26 to 34 years | 75 |
| 35 to 44 years | 80 |
| 45 to 54 years | 87 |
| > 55 | 84 |
Results of survey by management position for FY2022
| Age Group | Average Score |
|---|---|
| Senior Leadership | 50.20 |
| Managerial Level | 71.75 |
| Supervisory Level | 67.55 |
| Associates | 67.13 |
| Employee Turnover | FY2019 | FY2020 | FY2021 | FY2022 |
|---|---|---|---|---|
| Total employee turnover | 8.65% | 11% | 13.58% | 15.22% |
| Total attrition (voluntary) | 5.19% | 7.46% | 6.53% | 11.15% |
| FY2022 | <30 years | 30-50 years | >50 years | ||||||
|---|---|---|---|---|---|---|---|---|---|
| Male | Female | Total | Male | Female | Total | Male | Female | Total | |
| Total employee turnover | 28.81% | 32.42% | 29.56% | 7.12% | 11.24% | 7.47% | 19.09% | 5.03% | 15.22 |
| Total attrition voluntary | 23.62% | 30.82% | 25.12% | 5.61% | 9.79% | 5.96% | 4.42% | 0% | 11.15 |
Annual engagement survey with Kincentric
Kincentric ‘Best Employers Global certification’ recognises leading employers who capture the full potential of their people to drive results, creating a competitive advantage. This certification compares industry peers to identify those who strive towards inspiring their people, sparking change, and accelerating business success. Based on the principles of ‘Intent-Design-Experience’, the robust evaluation framework assesses the uniqueness and key differentiators of an organisation that makes it the ‘Best Employer’. Diversity in the workplace is a special focus area that impacts the final results.
Through an annual engagement survey with Kincentric, we arrived at a cumulative engagement score of 73% across Vedanta. We also had to qualify for the People Practices Index & CEO Questionnaire, which are taken into consideration for the survey results.
Employee engagement was measured on the
following grounds:
Agility
Adaptiveness, innovativeness, inclusiveness, and responsiveness to the dynamic needs of customers.
Engaging leadership
How deeply connected leaders are with employees to drive engagement, communicate a clear vision and exert strong personal values.
Talent focus
How focused an organisation is on attracting and retaining talent and creating an inspirational environment where people can thrive.
73%
EMPLOYEE ENGAGEMENT SCORE
Examining living wage
Minimum wage criteria is used by regulators to ensure that there is a floor-wage paid for unskilled, semi-skilled, and skilled workforce. The goal is to prevent exploitation of the workforce by under-paying them. Sites across Vedanta pay significantly higher that minimum wage levels.
However, while these pay slabs meet the basic living requirements, given the adversity faced by individuals as a result of the COVID-19 pandemic and its associated economic impact, it was felt by Vedanta’s management team that we needed to relook at how we factor minimum pay.
We turned to the living wage methodology as a model to evaluate the criteria and the wage requirements for families to afford adequate shelter, food, and other necessities.
This initial assessment has given us a baseline against which we can draft a living wage policy to be incorporated across our business. By FY2030, we commit to define the living wage across all our locations of operation and to assess the wage structure of full-time employees, contractors, business partners and suppliers. This assessment is to identify the strata of our workforce who are earning below the decided threshold and take necessary actions to ensure that no employees are devoid of decent living conditions and compensation.
As an indicator of our commitment to raise the living standards of our workforce, 6,000 junior employees were given a Chairman Discretionary Award to act as a one-time income supplement. This was to help tide-over some of the impacts of rising prices on family incomes.
We have referred to “The Asia Floor Wage” study for calculating a living wage threshold for India. The study has considered factors including:
- The number of family members to be supported
- Basic nutritional needs of a worker
- Housing, healthcare, education and savings.