AIM 4

Net Zero Carbon by 2050 or sooner

Climate change poses a grave risk to society, and it is the responsibility of all global actors to commit to decarbonise themselves at an urgent pace. We support the Paris Agreement to limit long-term global average temperature rise to well below 2oC and to pursue efforts to limit warming to 1.5oC. We welcome the Government of India’s decision to make India a net zero carbon economy by 2070.

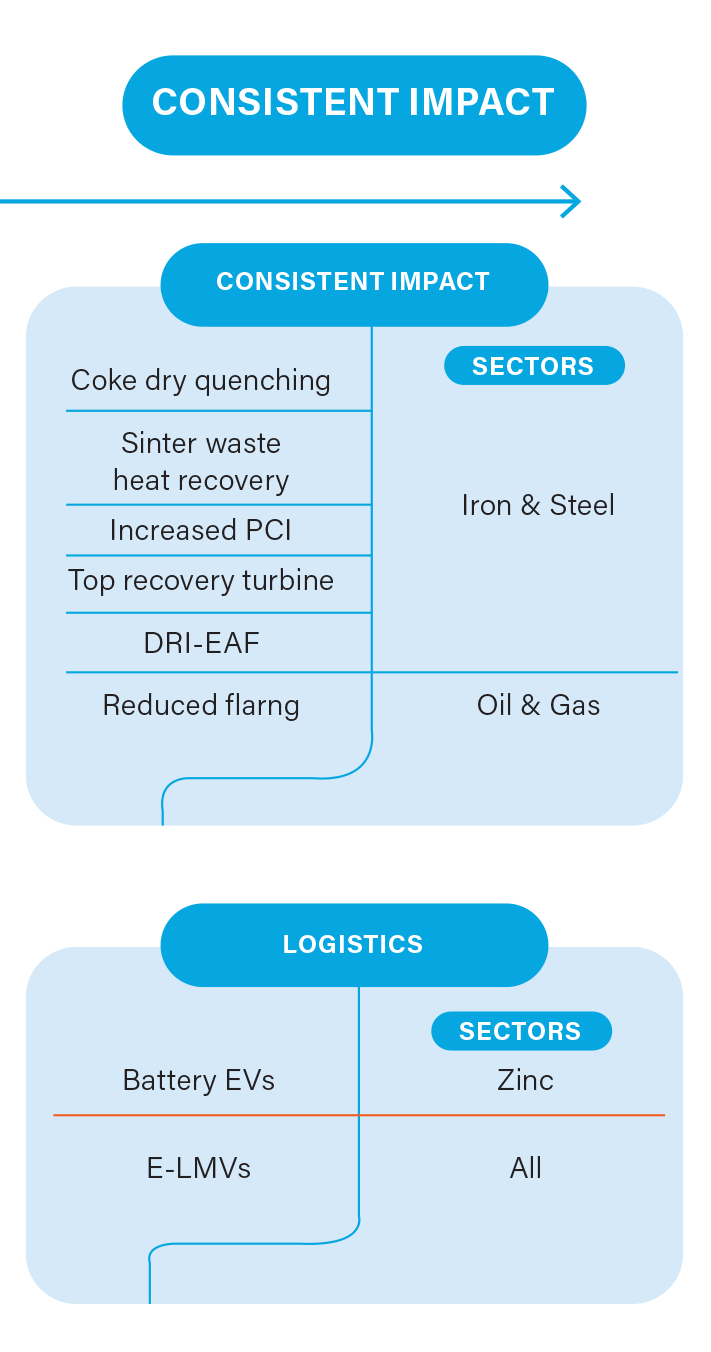
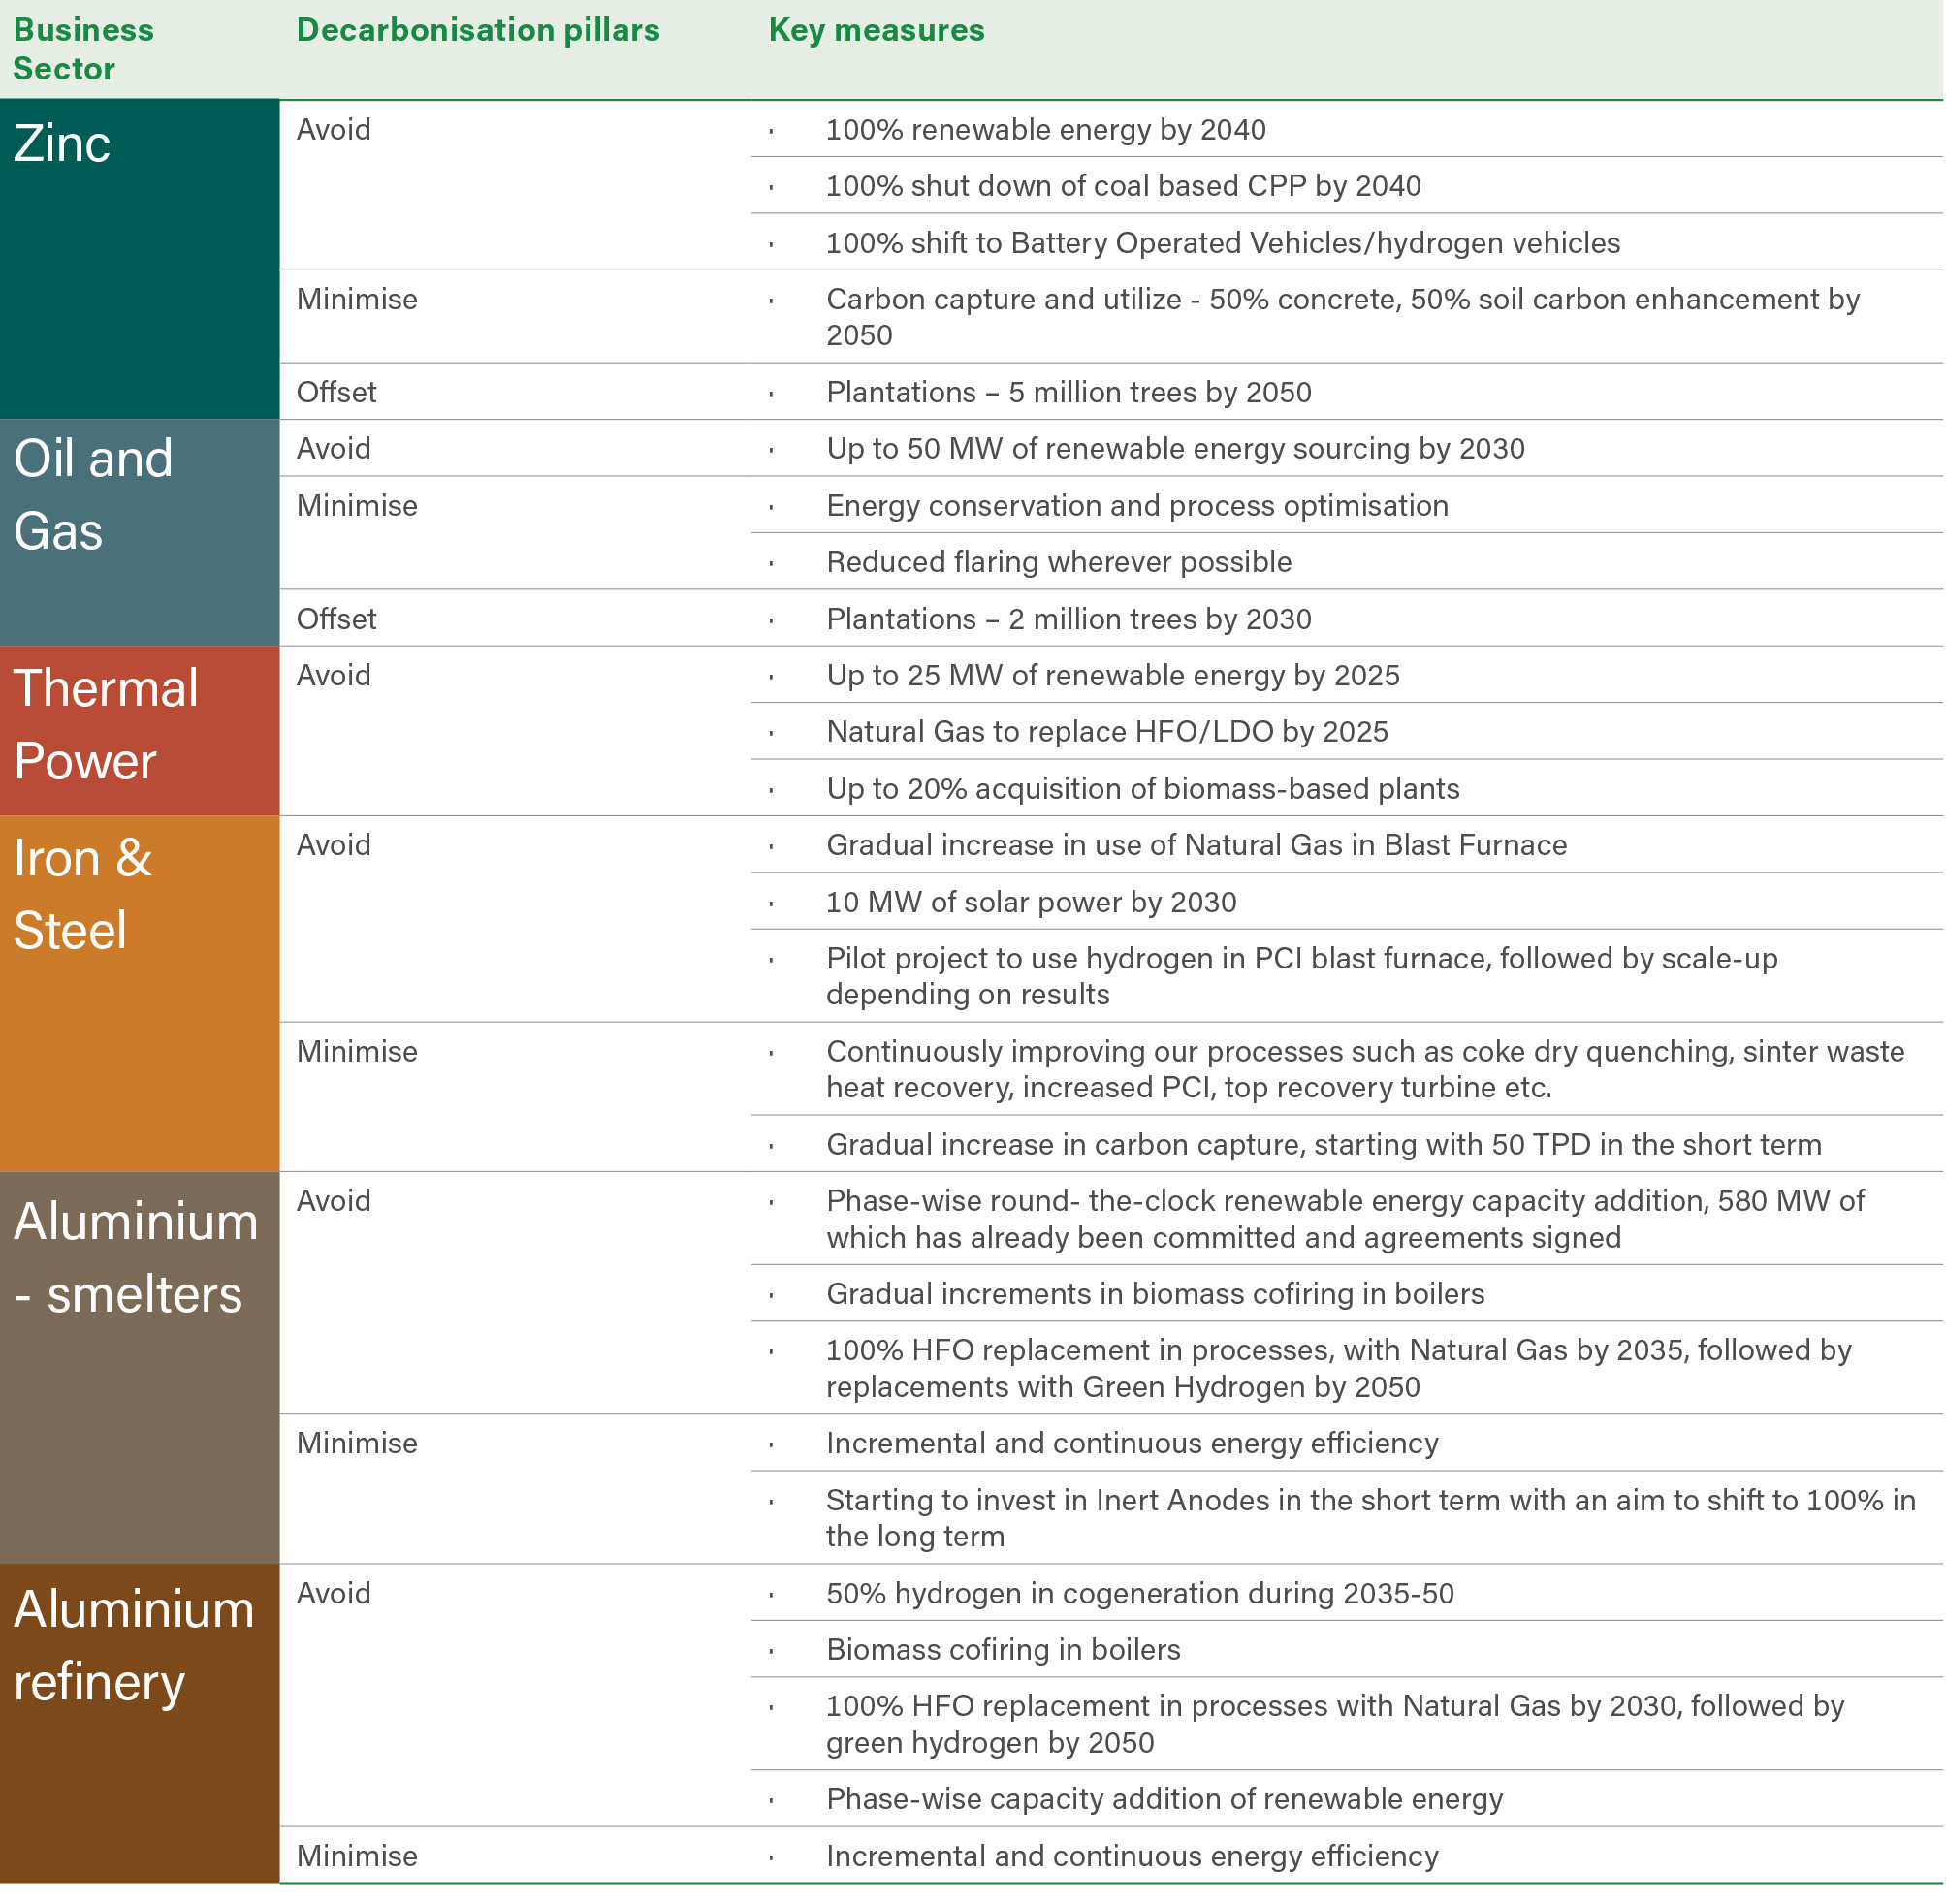
We have set ourselves carbon reduction targets that are in alignment with these national and international goals. Through a well-considered strategy to improve our energy and process efficiency together with a diversification of our energy mix across all operations, we intend to meet our goal of Net Zero Carbon by 2050 or sooner.

Key material issues

Climate change and decarbonisation

SDGs impacted

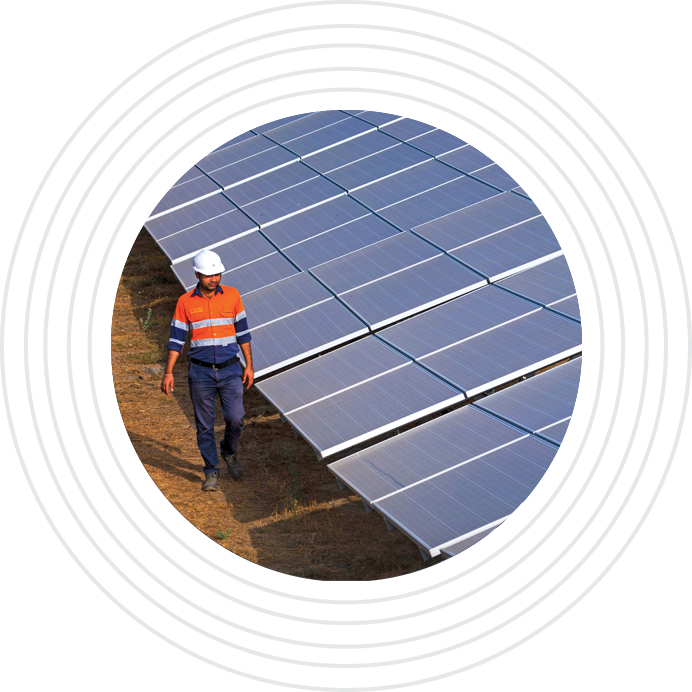
Sub-goals7.2: By 2030, increase substantially the share of renewable energy in the global energy mix

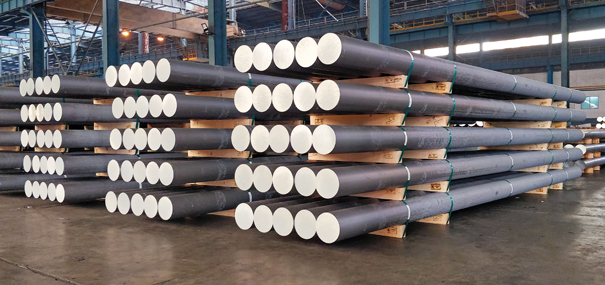
12.2: By 2030, achieve the sustainable management and efficient use of natural resources

13.2: Integrate climate change measures into national policies, strategies and planning

FY2022 was a watershed year for Vedanta’s decarbonisation ambitions. We significantly ramped up our ambition and our preparation to decarbonise our business. In a prelude to COP26, Vedanta announced its commitment to become a net zero carbon organisation by 2050 or sooner. This target, alongside our 2030 GHG reduction commitment in in support of the 2oC Science Based Target Initiative (SBTi) scenario.

We also conducted an in-depth climate risk assessment and scenario analysis to comprehensively understand the risks and opportunities posed by climate change to our business. The findings of these studies are being used as inputs for our carbon strategy and roadmap to achieve Net Zero status by 2050. For the first time, we completed the task of inventorising our Scope 3 emissions and concluded discussions on setting an Internal Carbon Price.

With this, the stage is set for the Company to deliver on its commitment.

Targets

25%

REDUCTION IN ABSOLUTE GHG EMISSIONS BY 2030 FROM A FY2021 BASELINE

500 MW

MW RE RTC (EQUIVALENT) BY 2025; 2.5 GW RE RTC (EQUIVALENT) BY 2030

20%

INTENSITY REDUCTION IN METALS AND MINING SEGMENT FROM A FY2021 BASELINE

10 million GJ

OF ENERGY SAVINGS BY 2025

Our 10 Net Zero commitments

  1. 01
    Net Zero Carbon by 2050 or sooner
  2. 02
    Use 2.5 GW of Round-The-Clock (equivalent) Renewable Energy and reduce absolute emissions by 25% by 2030 from a FY2021 baseline
  3. 03
    Aim to spend US$5 billion over the next 10 years to accelerate the transition to Net Zero carbon
  4. 04
    No additional coal-based thermal power and use of coal-based power only till the end of the existing power plants’ life
  5. 05
    Decarbonise 100% of our Light Motor Vehicle (LMV) fleet by 2030 and 75% of our mining fleet by 2035
  6. 06
    Commit to accelerate adoption of hydrogen as fuel and seek to diversify to hydrogen fuel or related businesses
  7. 07
    Ensure all our businesses account for their Scope 3 GHG emissions by 2025
  8. 08
    Work with long-term Tier 1 suppliers to submit their GHG reduction strategies by 2025 and align with our commitments by 2030
  9. 09
    Disclose our performance in alignment with Taskforce on Climate Related Financial Disclosures (TCFD) requirements
  10. 10
    Help communities adapt to the impacts of climate change through our social impact/CSR programmes

More details about Vedanta’s climate strategy can be found in our FY2022 TCFD Report.

CLIMATE RISKS, OPPORTUNITIES AND DECARBONISATION STRATEGY

In line with TCFD recommendations1 in FY2022, we undertook a comprehensive study to understand the impact of climate change on the business under different scenarios. This climate risk assessment sought to identify physical and transition-related climate risks and formulate strategies to enhance our resilience. This assessment also covered the socio-economic vulnerability of communities around our operations and the identified climate changerelated adaptation interventions.

Physical Risk

Our physical risk assessment considered two scenarios based on IPCC Representative Concentration Pathways (RCPs):

  • High Climate Change Scenario (RCP 8.5): Continuation of business as usual with emissions at current rates. This scenario results into excess warming of up to 4oCelsius by 2100.
  • Moderate Climate Change Scenario (RCP 4.5): Strong mitigation actions to reduce emissions to half of the current levels by 2080. This scenario is more likely than not to result in global temperature rise between 2oC, and 3oC by 2100.

Exposure, hazard, sensitivity and adaptive capacity assessments were conducted, for both the short-term (2039) and long-term (2059) scenarios. Assessing the asset value exposed to physical risks, helps us in informed decision-making and taking appropriate mitigation actions.

Exposure of BUs to Physical Risks

We anticipate that until 2040, under the RCP 4.5 scenario, 11% - 34.5% of the asset value is at risk from climate-related events if we do not undertake any adaptive or resilience measures.

Transition Risk

Transitioning to a lower-carbon economy requires extensive changes in policies, regulations, technologies and markets to address mitigation and adaptation requirements related to climate change. Depending on these changes, transition risks may pose varying levels of financial and reputational risks to our organisation.

To assess the impact of transition risks on our business, we used five NGFS (Network for Greening the Financial System) reference scenarios covering three aspects of its scenario matrix including orderly, disorderly, and hot house world.

The five scenarios used for Vedanta’s transition risk analysis

  • Current Policies Scenario: Under this scenario, existing climate policies stay in place without strengthening the ambition level of these policies.
  • Nationally determined contributions (NDCs) Scenario: This scenario foresees that India’s currently pledged NDCs gets implemented fully, and respective targets on energy and emissions in 2025 and 2030 are achieved.
  • Below 2°C scenario: This scenario imposes strict temperature targets. The Below 2°C scenario keeps the 67th-percentile of warming below 2°C throughout the 21st century.
  • “Net Zero 2050” scenario: This scenario foresees global CO2 emissions to be at net-zero in 2050. Furthermore, countries committed to specific netzero targets in 2020 (i.e., China, EU, Japan, and United States of America) are assumed to meet their targets.
  • Delayed Transition scenario: For the delayed scenario, a 2°C temperature target was imposed for 2100 and allows for temporary overshoot.

Our portfolio could be broadly understood as spread across 4 types, with the Thermal, Oil and Gas at the highest transition risk as there is carbon in the product and currently with RE it can be easily substituted. The least transition risk is to our aluminium, copper, zinc business except through its processing.

We anticipate transition risks to remain low in the near term (until 2035), however we are monitoring emerging regulations such as the Cross Border Adjusted Mechanism (CBAM) in Europe that could potentially increase our risk exposure due to decreased market access, given our current operating scenario.

Decarbonisation Strategy

Net Zero Carbon by 2050 or sooner is an ambitious (albeit essential) commitment for a business that is currently predominantly powered by coal-based energy. To deliver on our goal, we have taken intermediate targets that will serve as milestones in this journey.

By FY2025, our metals businesses, which represent more than 75% of our current GHG emissions, would have reduced their GHG intensity by 20% from a FY2021 baseline. An intensity-based target is essential in the short term because it will help drive improvements at a stage in our business when we plan to expand our operations. Based on current projections, we anticipate our absolute GHG emissions to peak between FY2025 and FY2027.

By 2030, we intend to reduce our absolute GHG emissions by 25% from a FY2021 baseline. To do so, we have developed a comprehensive net zero roadmap at each of our BUs. The roadmap focuses on governance structures, technology interventions and continuous monitoring of our progress.

A broad outline of this roadmap is presented in the table below:

Net-Zero Roadmap Policy and Governance Risk Management Targets and Metrics
Short Term (1-4 years)
  • Draft Climate Resilience response strategy covering identified climate risks
  • Develop mandatory mitigation assessment guidelines for all new projects, mergers and acquisitions including mandate to increase renewable Energy share, mandating use of Best Available Technologies
  • Integrate decarbonisation goals with the annual Business Planning process
  • Embed climate KPIs into performance appraisal parameters for executives and managers
  • Develop a supplier engagement programme to drive strengthen climate action across the value chain
  • Engage with community members to build climate resilience programmes/integrate climate adaptation into existing CSR programmes specific to the identified risks
  • Adapt existing enterprise-level and other risk management processes to take account of loss and damages incurred/ projected from cyclone events or heat waves
  • Plan to use the same quality assurance and compliance approaches for climaterelated information as for finance, management, and governance disclosures
  • Embed Internal Carbon Pricing into the business decision-making process
  • Define a framework to consolidate BU-level targets and achievements to align with and track progress against group level targets – e.g., Net Zero by 2050, 25% absolute reduction in emissions by 2030
  • Strengthen Scope 3 accounting and identification of emission hotspots within the value chain
  • Set up specific, annualised targets for use/deployment of renewable energy
Medium Term (4-10 years)
  • Identify and pilot green business opportunities involving RE storage technologies, electrolysers, etc.
  • Identify and carry out policy advocacy on specific areas – e.g., policy towards mitigating technological and contractual barriers of moving away from coal, just transition, removal of infrastructural bottleneck on use of cleaner fuels.
  • Develop BU-level adaptation plans based on identified climate risks and the technofeasibility assessments
  • Engage with external key stakeholders (along the supply chain) to manage risks
  • Identify/validate businesscritical suppliers of goods and services who are exposed to high physical and transition risks
  • Assess and quantify the impact of the loss of the critical suppliers in the event of climate disasters, or in case of low carbon transitions
  • Set a target for Scope 3 emissions reduction for material categories
  • Decide on the key suppliers, customers to handhold with for reduction of their Scope 1 and 2 targets (i.e., Vedanta’s Scope 3 target)
  • Drive adoption of science-based emission reduction targets by suppliers and/or customers
  • Define climate change relevance of the CSR programmes – carry out BU wise studies on how and to what extent the CSR programmes are addressing the climate change risks and vulnerabilities as identified
Long Term (10+ years)
  • Update the Net Zero plan taking into consideration newer regulatory, market requirements and achievements of short- to medium-term targets set by the Group
  • Develop and implement a Just Transition plan
  • Install measures to reduce exposure to physical climate risks identified
  • Consider insurance or additional climate fund (enhanced ICP) for emergency purposes
  • Revise climate budget, ICP, GHG emission reduction targets according to the revised climate risk assessments
  • Set up specific targets on use of clean technologies – CCUS, green hydrogen

DECARBONISATION LEVERS

To make an orderly transition to a net zero carbon organisation, we plan to use six key levers for decarbonisation:

  1. Switch the green power wherever feasible
  2. Switch to low-or-zero-carbon fuels where transition to green power is not possible
  3. Improve the carbon efficiency of all our processes
  4. Collaborate with leading institutions to pilot application of new technologies such as green hydrogen
  5. Ensure that all new growth is low-or-zero-carbon
  6. Purchase high-quality carbon offsets for residual GHG emissions

Internal Carbon Pricing

Vedanta will adopt an Internal Carbon Price for our businesses from the second half of FY2023. We will be using a shadow price of US$15/tCO2e (`1,125/tCO2e) for capex projects greater than US`50 million or for those projects whose absolute GHG emissions are greater than 0.5 million TCO2e.

DELIVERING ON OUR DECARBONISATION COMMITMENTS

In FY2022, Vedanta put in place several programmes that will help decarbonise our operations. Our efforts were not limited to merely mitigating our impact, but also sought to realise opportunities that will help position the Company as a leading low-carbon, green metal producer.

CASE STUDY

Vedanta launches its first line of green metal products

Our approach to decarbonisation is not limited to minimising our carbon footprint. In FY2022, we forayed into developing low-carbon products for the industry. Our Aluminium business launched ‘Restora’ and ‘Restora Ultra’ – green product lines for the metal, and thus joining an elite league of global players. The GHG intensity of these metals is significantly below global standards for lowcarbon aluminium.

We became the first Indian aluminium manufacturer to make products using low-carbon aluminium under the Restora name. Restora, as its name suggests, is a part of our initiatives to restore the ecological balance and aid in the transition to a low-carbon future. Minerals and metals will be extremely important in this transformation.

Restora’s GHG emission intensity, which is produced using renewable energy, is almost half the global standard of 4 tCO2e per tonne of aluminium produced. Restora Ultra has almost no carbon footprint since it is made from aluminium that is reclaimed from dross, a by-product of the production of aluminium.

Our Aluminum business used over 2 billion units of renewable energy in 2021 to create the first batch of Restora, making it India’s largest industrial consumer of renewable energy.

With Restora, we have joined the exclusive global club of low-carbon aluminium producers

The introduction of Restora is indicative of the opportunities that exist as we decarbonise our processes. Restora gives our customers, who are now more aware than ever of the origins of the products they consume, a distinct competitive advantage through environmentally-friendly aluminium products. We have teamed up with Runaya Refining, one of India’s rapidly expanding manufacturing start-ups devoted to developing cutting-edge solutions for the resources sector, to manufacture Restora Ultra.

Global standard

4 tCO2e/t

OF METAL

Restora

2.36 tCO2e/t

OF METAL

Restora Ultra

0.37 tCO2e/t

OF METAL

Switching to Green Power

In FY2022, Vedanta Aluminium became the largest consumer of green energy in India when it purchased 2 billion units of green power on Indian Energy Exchange Limited (IEX).

Further strengthening our commitment to decarbonise our energy mix, we have signed a Power Distribution Agreement to bring 580 MW of RE RTC (eq) online by FY2024.

A break-up of this 580 MW is as follows:

200 MW

AT BALCO

180 MW

AT VAL-JHARSUGUDA

200 MW

AT HZL

Vedanta is the largest industrial consumer of renewable energy

Our Aluminium business, India’s largest producer of aluminium and value-added products, also became the largest procurer of RE on India’s power exchanges – IEX and Power Exchange India Limited (PXIL). The ~2 billion units of RE was for the aluminium smelter at the Jharsuguda unit, which is now India’s largest RE buyer on Green Term Ahead Market (G-TAM) platform at IEX. This purchase also helped reduce 1.5 million TCO2e of GHG emissions. Our subsidiary, Bharat Aluminium Company (BALCO), led the RE trading session, procuring around 59% of the traded RE certificates (RECs) in November 2021 alone, and a total of over 2,861,700 RECs during the year.

“We are committed to our vision of achieving Net Zero Carbon by 2050. To achieve this, we have stepped up our endeavours along three key pillars by continuously improving the energy efficiency of our operations, increasing the proportion of renewable energy in our energy mix and replacing fossil fuels with greener and cleaner alternatives. Being India’s largest industrial consumer of renewable energy in FY2022 showcases our persistent endeavours to increase the share of green power in our energy mix and accelerate our transition into low-carbon operations.”

Mr. Rahul SharmaCEO – Aluminium Business, Vedanta Limited

Fuel Switch Programmes

Fuel switch is another key lever of our decarbonisation strategy. We have several programmes underway to reduce the carbon load of our processes.

Biomass firing

We are committed to using 5% biomass in our thermal power plants. We are already using biomass in the following way:

17 kt

OF BIOMASS USED IN HZL

Pilot programmes underway at BALCO,
VAL-Jharsuguda, VAL-Lanjigarh

Natural gas

We have initiated a partnership between VAL-Lanjigarh and GAIL to supply natural gas for calciner, substituting coal use, which will potentially decrease plant GHG intensity by 10%.

Electric mobility

We are committed to decarbonise 100% of our LMV fleet by 2030 and 75% of the mining fleet by 2035. Our achievements so far:

11 EVs

DEPLOYED AT HZL

40 EVs

DEPLOYED AT ESL

HZL has also signed an MoU with Sandvik AB to introduce battery-powered loaders and trucks in underground mining. It is set to introduce Sandvik’s battery-electric TH550B trucks and LH518B loaders in underground mines to reduce carbon emissions and make mine operations more environmentally friendly.

Electric forklift fleets

Vedanta Aluminium business has signed an agreement with Gemini Equipment and Rentals Private Limited (GEAR) India, to deploy one of the largest fleets of lithiumion battery-powered electric forklifts, becoming the first in Indian aluminium industry to undertake such an initiative. VAL has purchased 23 e-forklifts at its aluminium smelter in Jharsuguda, Odisha. Substituting diesel-fuelled forklifts with this green fleet will reduce diesel consumption by more than 2.5 lakh litres annually, thereby ensuring GHG (greenhouse gas) emission savings of nearly 690 tCO2e.

Energy efficiency measures

Energy efficiency measures remain the predominant way to reduce GHG emissions across our business. More than 160 projects were implemented across all BUs, resulting in more than 3.8 million GJ of energy savings.

The top 10 projects were responsible for more than 67% of our energy savings.

Business Unit Top 10 Energy/GHG Savings Initiatives Energy Savings (GJ) Avoided emissions
VAL- J Metal Addition of 332 pots with 100% graphitised cathode 11,15,339 6,62,201 TCO2e
for FY2022
HZL Chanderiya CPP Unit 2 Turbine Revamping 4,06,555
BALCO Metal Conversion of 120 pots with 100% graphitised cathode 303,581
HZL Chanderiya CPP Unit 3 Turbine Revamping 2,94,453
VAL-J IPP Unit 3 condenser cleaning & air ingress rectification 2,82,861
TSPL Improved Unit 3 HPT performance 2,41,953
HZL Chanderiya CPP Unit 1 Turbine Revamping 2,10,380
HZL Dariba CPP Unit-2 Turbine Revamping 79,610
VAL- J Metal Unit 6 CT fills replacement 66,848
HZL Dariba CPP Unit-1 Turbine Revamping 65,363
Total (all projects combined) 3,797,436

GHG emissions and energy consumption

Performance trends

GHG emissions

In FY2022, the total Scope 1 and Scope 2 emissions from our operations was 62.83 million metric tonnes CO2e, a slight increase of 4.2% from the previous year.

GHG emissions (tCO2e) FY2022 FY2021 FY2020 FY2019
Scope 1 (direct) 59,486,747 58,936,259 57,482,868 54,964,436
Scope 2 (indirect) 3,342,745 1,312,818 1,864,711 3,506,187
Total 62,829,492 60,249,077 59,347,579 58,470,623

We calculate and report Greenhouse Gas (GHG) inventory i.e. Scope 1 (process emissions and other direct emissions) and Scope 2 (purchased electricity) as defined under the World Business Council for Sustainable Development (WBCSD) and World Resource Institute (WRI) GHG Protocol.

In FY2022, we completed our first assessment of our Scope 3 emissions. The Scope 3 accounting was prepared based on the GHG Protocol’s Scope 3 Value-Chain Accounting and Reporting Standard. For Oil & Gas and Steel sectors, sector specific standards were used. To determine, which of the 15 upstream and downstream categories were relevant for our business, we conducted a materiality assessment that used the following criteria of significant - magnitude, influence, stakeholder interest, sector guidance and risks.

The following categories are applicable for Vedanta’s Scope 3 emissions:

Category Applicability Remarks
Category – 1 – Purchased Goods & Services The Category 1 is material and emissions are estimated for all BUs The category is applicable to all Business units and all major material consumption (raw material) is accounted
Category 3 – Fuel & Energy Related The Category 3 is material and emissions are estimated for all the business units -
Category 4 – Upstream Transport The category 4 is material and emissions are estimated for all the business units -
Category 5 – Waste Generated in Operations The category 5 is not material, but emissions are estimated for major waste processing. Also transport emission (which is optional to report in Category 5) associated with Waste transport is also estimated. Across BUs – Waste such as fly ash, SPL, red mud, etc. are reprocessed and used as alternate raw material/fuel in other industries. The emissions related to transporting waste have been estimated, however as these wastes substitute the use of fossil fuels or other raw material, these emissions are not estimated for recycling/coprocessing
Category 6 – Business Travel The category is not material and emissions are estimated for business units -
Category 7 – Employee Commute The category is not material and emissions are estimated for business units The emissions reporting under this category is not comprehensive as many of the BUs are not having the data in required format to estimate the emissions. However, data gaps will be addressed in subsequent inventory and comprehensive reporting will be targeted under the category. But the current gaps will not have significant impact on the inventory
Category 9 – Downstream Transport The category 9 is material and emissions are estimated for all the business units -
Category 10 – Processing of Sold Products The category 10 is material for – Oil & Gas sector, steel sector and VZI which produces intermediate products (Crude Oil, Natural Gas, Copper and Zinc Concentrates and pig iron) which would require further processing downstream. For Alumina business this category would be applicable, but as all alumina produced is consumed within same Group companies the emissions for alumina to Aluminium conversion is not reported under this category.
For other businesses - this category would not be applicable as the final products are either used directly with minimum or no further processing.
Category 11 – Use of Sold Products The emissions are material and estimated for Oil & Gas business and Coke production Value Added Business The category 11 is applicable to the Oil & Gas and Value-Added Business (VAB) of Vedanta Group. The emissions from processing of crude and further use of refined products are estimated for Oil & Gas business and Coke usage (as reducing agent) is estimated for VAB business.

Scope 3 emissions account for ~35% of our overall GHG emissions in FY2022

Scope 3 - Inventory Group

Total Scope 3 Emissions (million t CO2e) FY2021 FY2022^
Categorization
Scope 3 - Upstream 7.23 7.71
Scope 3 - Downstream 28.98 26.49
Total 36.20 34.19
Scope 3 - Inventory Group (Category wise)
Sources of Scope 3 Emissions (million t CO2e) 2020-21 2021-22
Category 1 - Purchased Goods & Services 4.16 4.98
Category 2 - Capital Goods Not Applicable Not Applicable
Category 3 - Fuel & Energy Related 2.15 2.53
Category 4 - Upstream Transportation 0.46 0.19
Category 5 - Waste Generated in Operations/td> 0.45 -
Category 6 - Business Travel 0 -
Category 7 - Employee Commute 0.01 -
Category 8 - Leased Assets Not Applicable Not Applicable
Category 9 - Downstream Transport 0.23 0.49
Category 10 - Processing of Sold Products 1.00 1.53
Category 11 - Use of Sold Products 25.16 24.47
      Crude Oil 22.3 21.63
      Natural Gas 2.63 2.47
      Coke 0.23 0.26
      Credit due to Slag Recycling/Reuse (0.43) (0.34)
Category 12 - End of Life Treatment of Sold Product Not Applicable Not Applicable
Category 13 - Downstream Leased Assets Not Applicable Not Applicable
Category 14- Franchises Not Applicable Not Applicable
Category 15 – Investments Not Applicable Not Applicable

^- FY2022 data is unassured

GHG emission intensity

Since 2012, we have reduced the GHG intensity of our operations by 21%, which has resulted in ~14 million TCO2e of avoided emissions. In FY2022, we revised our GHG emissions intensity targets. Our new goal is to reduce the GHG emissions intensity of our metals businesses by 20% by FY2025 from a FY2021 baseline.

Towards this goal, we have reduced the GHG emissions intensity by 4.8% in FY2022.

FY2021 FY2022
Production (MMT) Emissions intensity (TCO2e/T of Metal) Absolute Emissions (MTCO2e) Production (MMT) Emissions intensity (TCO2e/T of Metal) Absolute Emissions (MTCO2e)
Aluminium 3.817 9.440 36.034 4.238 8.881 37.636
Steel 1.286 2.296 2.952 1.370 1.878 2.573
Iron Ore Business 0.593 2.819 1.670 0.789 2.579 2.035
FACOR 0.068 6.403 0.438 0.075 6.164 0.464
Zinc International 0.315 0.693 0.218 0.223 1.078 0.240
Zinc India 0.978 5.002 4.890 0.968 4.980 4.819
Copper India 0.118 0.891 0.105 0.132 0.763 0.101
Total 7.175 6.454 46.308 7.794 6.141 47.868

Note: Scope 1 and Scope 2 are considered for calculation

GHG intensity for overall GHG intensity TCO2/INR Mn

GHG emission intensity (tCO2e/INR Mn) FY2022 FY2021 FY2020 FY2019
Scope 1 45.39 60.61 69.13 60.64
Scope 2 2.55 1.35 2.24 3.86
Total 47.94 61.95 71.37 64.50

2 The credit due to slag (applicable for Iron & Steel) has been highlighted in overall Scope 3 inventory but are considered as avoided emissions and thus not adjusted in overall inventory.

Direct and indirect energy consumption

Our energy consumption increased marginally by 7.5% in FY2022.

Energy consumption (million GJ) FY2022 FY2021 FY2020 FY2019
Direct 531.88 515.67 518.17 483.90
Indirect 32.09 8.75 7.80 62.76
Total 563.68 524.51 525.97 546.67

Renewable and non-renewable energy consumption

In FY2022, we significantly increased the share of renewable energy in our energy mix from 67 MW in the previous fiscal to 465 MW in FY2022. The purchase of RE by the aluminium sector drove this rise in consumption.

Energy Consumption (million GJ) FY2022 FY2021 FY2020 FY2019
Renewable 14.62 2.13 0.60 0.27
Non-renewable 549.35 522.39 525.37 546.40
Total 563.98 524.51 525.97 546.67
Energy Breakup Direct Indirect Grand Total
FY2022 Renewable Non- Renewable Renewable Non- Renewable
Energy Consumption (million GJ) 1.12 530.76 13.51 18.58 563.98